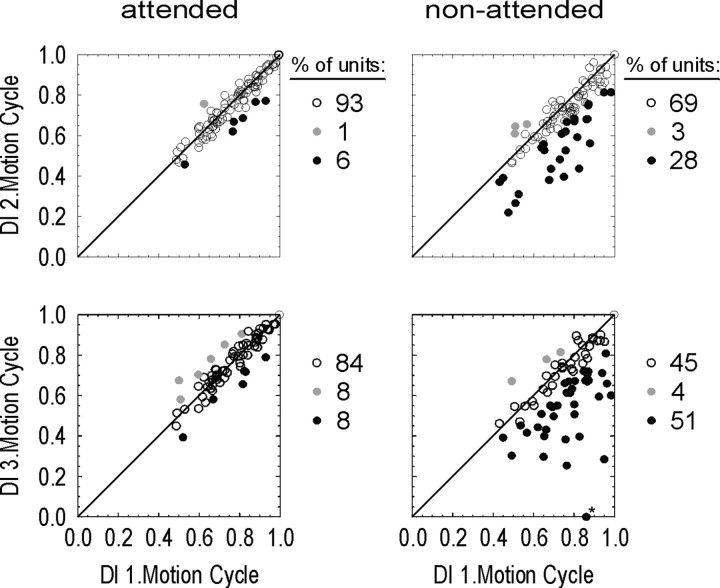
Figure 3.
Change of direction selectivity over motion cycles in the DB experiment. The plots show the DI of all units for the second (top row) and third (bottom row) motion cycles against the first one with attention either directed to the RF (left column) or away from it (right column). Open circles, Selectivity not significantly changed over time; filled gray circles, selectivity significantly increased; filled black circles, selectivity significantly decreased. Numbers to the right of the scatter plots indicate the proportion of these cases within the population. The plots show that the majority of neurons recorded in the attended condition have constant direction selectivity over time. For the nonattended condition, 28% of neurons in the second motion cycle and 51% during the third one showed significantly reduced direction selectivity. The asterisk indicates a neuron for which the corresponding data point was placed on the null axis, although the neuron had a negative DI value (-0.03) in the third motion cycle.

