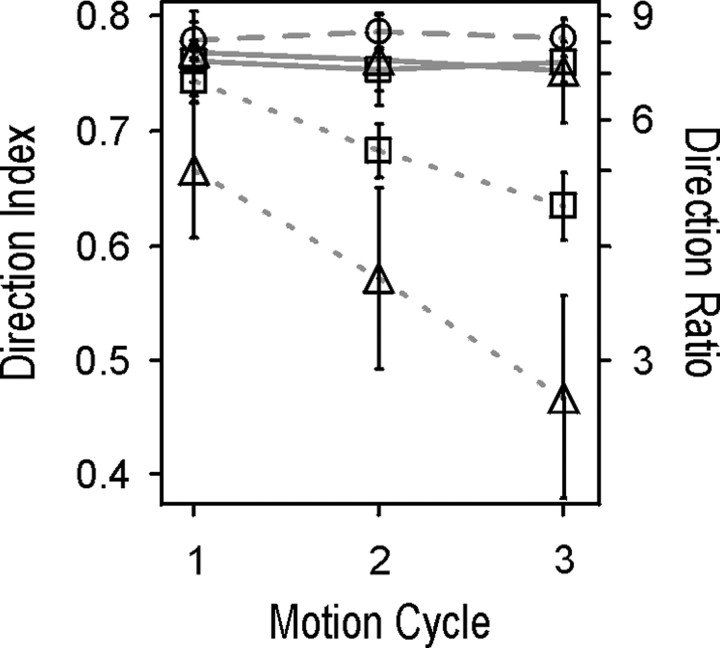
Figure 7.
Comparison of average direction selectivity of the populations of neurons recorded under different behavioral conditions. Circles connected with dashed line, Passive condition; squares, DB experiment; triangles, NB experiment; straight lines, attended condition; dotted lines, nonattended condition. For both attended conditions, the plot shows high and constant direction selectivity over time as it was otherwise measured only for the single motion stimulus in the passive condition experiment. In the nonattended conditions, direction selectivity showed a continuous decline over time, which was more pronounced if target and distracter bar were presented in reduced distance. Error bars indicate relative coefficient of variation.

