Figure 2.

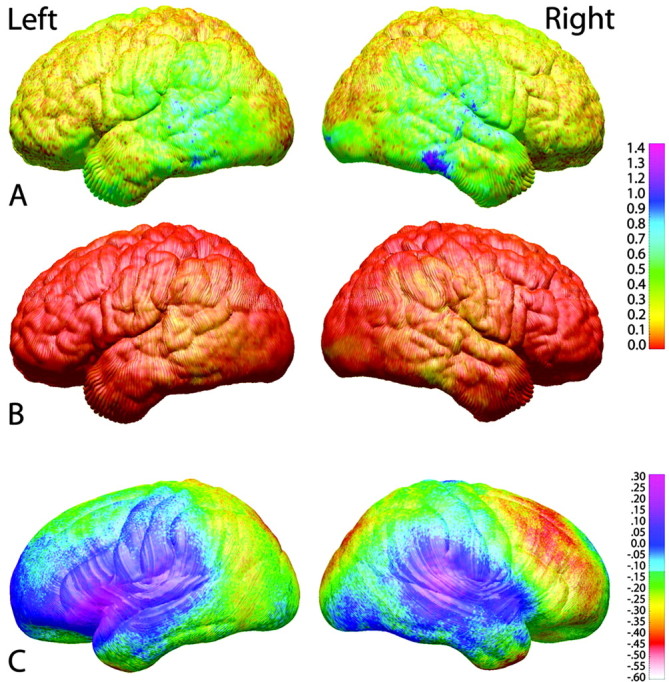
Error estimation maps. A, In the top row, a map of the average absolute value of the cortical thickness difference between short-interval scans for the five subjects is shown. The average error estimate for these subjects ranges from 0 to 1.4 mm. B, To estimate the error for each individual in the larger group of 45 subjects, we divided the average error maps by the square root of 45 minus 1. Thus, the estimated error for each of the 45 subjects ranges from 0 to ∼0.15 mm, which is considerably less than the maturational difference observed in these 45 children over a 2 year interval (C), which ranges regionally from -0.6 to 0.3 mm.
