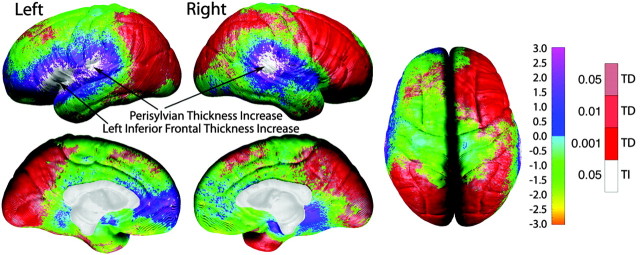
Figure 6.
One-sample t test map for gray matter thickness. These brain maps show the statistical significance of annualized change in cortical thickness measures. Color coding represents t values at each cortical surface point according to the left color bar (ranging from t = -3.0 to t = 3.0), and significant values are overlaid in shades of red [significant thickness decreases (TD)] and white [significant thickness increases (TI)] according to the color bar on the right. Arrows point to the three regions of significant gray matter thickness increases, representative of the only three regions to withstand permutation correction for multiple comparisons for thickness increase shown in Table 1.

