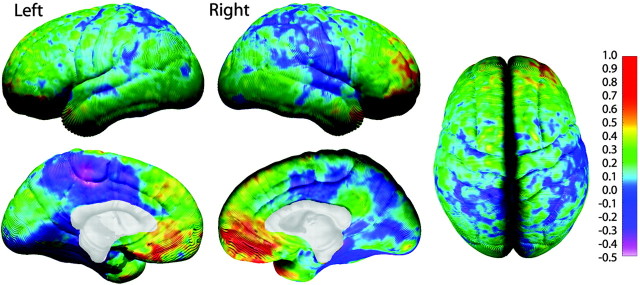
Figure 7.
Annualized rate of change in DFC (lateral surface) and DFC-H (medial surface). Brain maps showing the annualized rate of change in DFC in millimeters according to the color bar. Corpus callosum and brainstem regions have been masked out of the midline views. Note the most prominent growth shown in red where brain size increases on average 0.5-1.0 mm per year.

