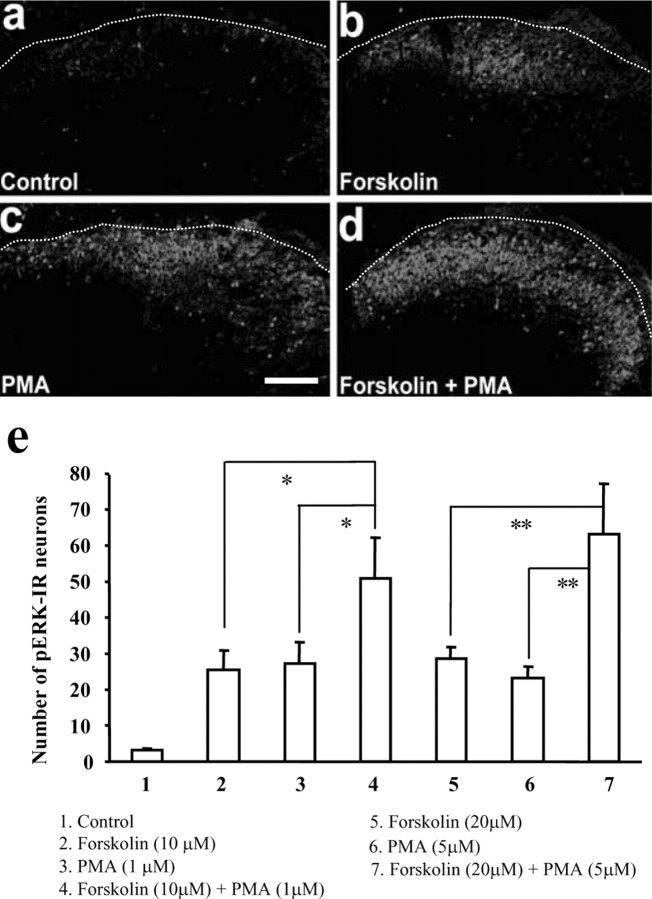
Figure 5.
a–d, pERK immunofluorescence in control unstimulated (a) and after exposure to the PKA activator forskolin (20 μm)(b), the PKC activator PMA (5 μm)(c), and forskolin plus PMA (d). Scale bar, 100μm. The dotted lines indicate the top border of the gray matter of the spinal cord. e, Numbers of pERK-IR neurons in the superficial dorsal horn after each treatment. ANOVA indicates an overall effect of these agents on pERK expression (F(6, 22)=16.442;p<0.0001).*p<0.05;**p< 0.01 (n = 3–5). All of the slices were fixed 20 min after drug exposure.

