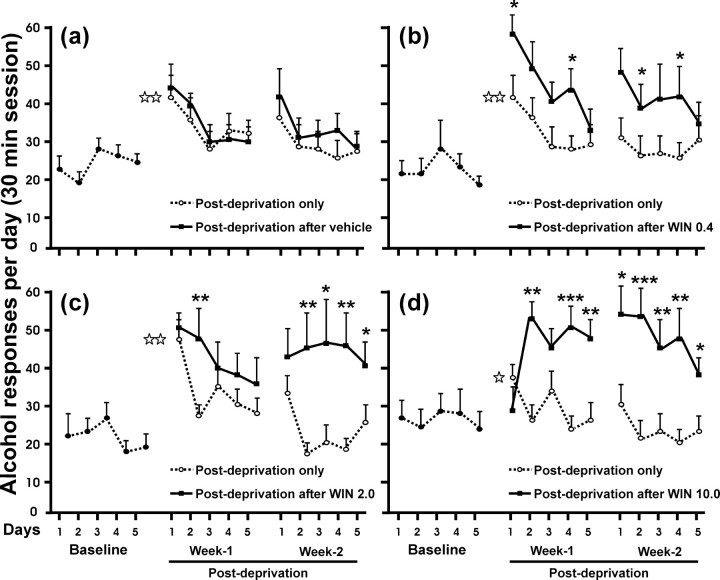
Figure 2.
Effects in relapse to alcohol after a single alcohol deprivation period (dotted lines, open circles) and relapse to alcohol after WIN 55,212-2 treatment during alcohol deprivation (black lines, filled squares). Doses of WIN 55,212-2 are in milligrams/kilogram. These data represent the responses for alcohol (30 min session) for 5 consecutive days with a 1 week interval between baseline and postdeprivation period and a 2 d interval between week 1 and week 2 of the postdeprivation period. Black asterisks show the statistically significant differences between the first and second week of alcohol relapse after a single alcohol deprivation and their corresponding first and second week of alcohol relapse after an alcohol deprivation period concomitant with WIN 55,212-2. Only the animals treated with WIN 55,212-2 showed statistically significant differences. Differences were not significant in the vehicle group. With the highest dose of WIN 55,212-2 (10.0 mg/kg) (d), the responding for alcohol seemed to be blocked on the first day of relapse after treatment but abruptly increased on the second day of relapse and was maintained during 2 weeks. White asterisks represent significant differences on day 1 for WIN and saline groups compared with their corresponding baseline values (alcohol deprivation effect). Values are expressed as mean ± SEM of responding for alcohol by days. *p < 0.05; **p < 0.01; ***p < 0.001.

