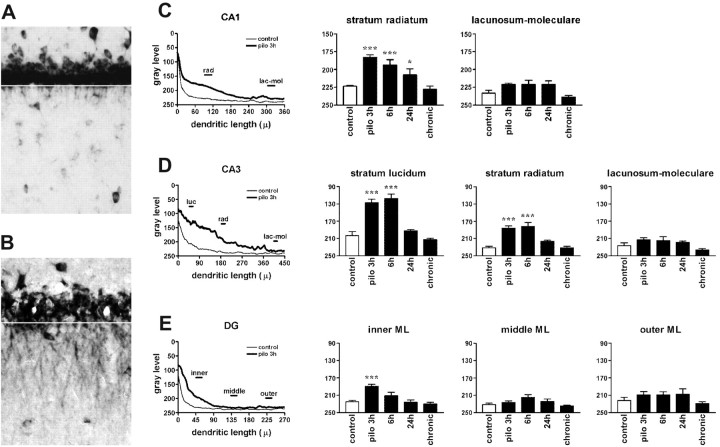
Figure 2.
Densitometric analysis of the effects of pilocarpine seizures. A, High-magnification of the CA1 region of a control animal (shown also in Fig. 1, control) showing proximal dendritic in situ staining for BDNF mRNA in pyramidal neurons and in interneurons within the stratum radiatum. B, CA1 region of a pilocarpine-treated rat (3 hr) showing dramatic enhancement of the BDNF mRNA in situ staining. Several strongly labeled dendrites are visible in the stratum radiatum but not in the stratum oriens. The white lines in A and B indicate the distance 0 from the cell soma used for the densitometric analysis. The left panels in C-E show the densitometric analysis of the dendritic labeling, expressed as pixel intensity (0-255 gray levels; 255 = white; 0 = black) as a function of the distance from the cell soma (in micrometers). Analysis was performed as described in Materials and Methods. Data are the means ± SE of four to six animals per group: control (thin line) and pilocarpine 3 hr (pilo 3h; thick line). Note that, under control conditions, the average gray level in CA1 and CA3 reaches background between 50 and 100 μm from the cell somas, whereas in the dentate gyrus it drops to background levels ∼40 μm from the cell bodies. *p < 0.05; ***p < 0.001 versus control values (□); ANOVA and post hoc Newman-Keuls test. lac-mol, Stratum lacunosum-moleculare; luc, stratum lucidum; ML, molecular layer; rad, stratum radiatum.

