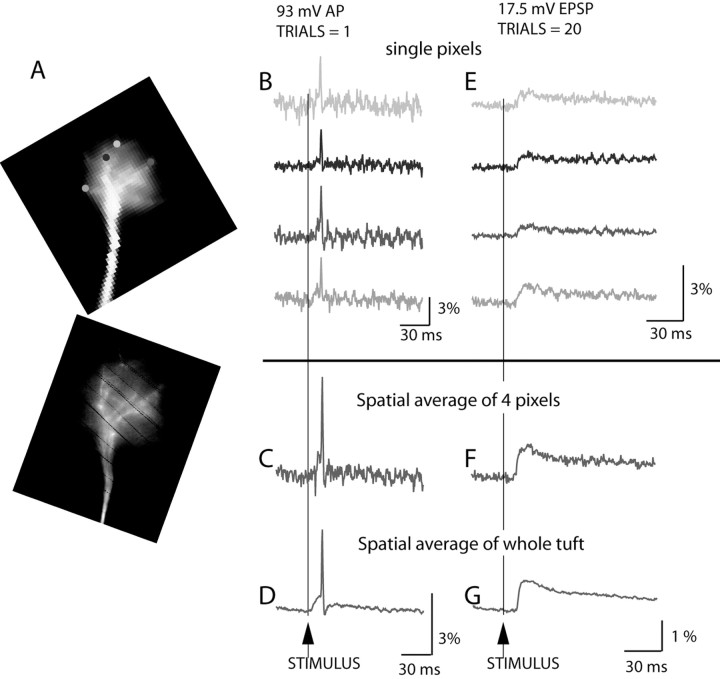
Figure 2.
Spatial resolution and sensitivity of voltage imaging. A, Low resolution (top) and high resolution image (bottom) of the terminal dendritic tuft. B, Recordings of action potential signals from four individual locations on the dendritic tuft in single-trial measurements (no averaging). C, The signal-to-noise ratio with spatial averaging of four pixels from B. D, The signal-to-noise ratio with spatial averaging of the entire tuft area. E, An evoked EPSP recorded from 4 individual locations on the dendritic tuft; 20 trials were averaged. F, Spatial average of four pixels shown in E. G, Spatial average of the entire tuft area.

