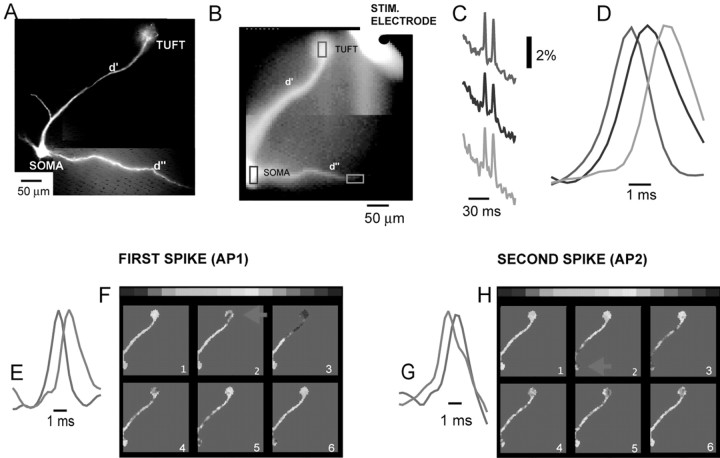
Figure 4.
Voltage imaging of the spike initiation and propagation pattern in a mitral cell stained with voltage-sensitive dye. The two consecutive spikes evoked by a single stimulus have different initiation sites and propagation patterns. A, A composite image of a mitral cell obtained with a conventional high-resolution CCD camera. Soma, primary dendrite (d′), terminal dendritic tuft, and a secondary dendrite (d″) are clearly visible in this fluorescence measurement. B, Single frame recording of the same cell obtained with a fast low resolution (80 × 80 pixels) CCD camera used for voltage imaging. C, Optical recording of action potentials evoked by olfactory nerve stimulation (single volley, 40 μA, 0.1 msec) obtained simultaneously from three different regions (B, red, blue, and green rectangles). D, The propagation of the first of the two spikes shown in C; expanded time scale. The earliest action potential (red trace) was initiated in the tuft and propagated toward the soma (blue trace) and secondary dendrite (green trace). The spike occurred with a delay of 2 msec in the distal part of secondary dendrite, ∼300 μm away from the soma. The propagation delay and the constant shape of the spike indicate active propagation. Action potential signals are scaled to the same height. E, The recordings from two selected locations [tuft (red) and soma (blue)] on the expanded time scale used to determine the propagation velocity of the first spike. F, Color-coded representation of the data showing spatial and temporal dynamics of the first synaptically evoked spike from C. The peak of the action potential, in this and all subsequent figures, is shown in red. Consecutive frames represent data points around the peak of the action potential separated by 0.37 msec. The first action potential was clearly initiated in the tuft (red arrow) and propagated to the soma. G, The recordings from two selected locations [tuft (red) and soma (blue)] on the expanded time scale used to determine the propagation velocity of the second spike. H, Color-coded representation of the data showing spatial and temporal dynamics of the second synaptically evoked spike from C. The second spike was initiated in the soma (red arrow) andpropagated to the tuft.

