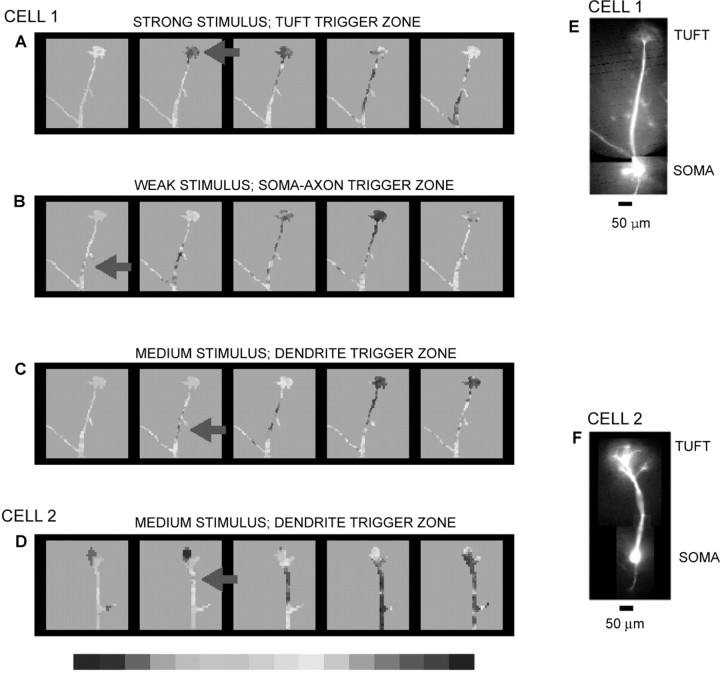
Figure 5.
Multiple spike trigger zones in two mitral cells (E, F). Color-coded representation of changes in fluorescence light intensity corresponding to action potentials evoked by olfactory nerve stimulation of different intensity. The peak of the action potential is shown in red. Individual frames are separated by 0.37 msec. Red arrow indicates the position of the trigger zone. A, A strong stimulus (60 μA, 0.1 msec) initiated the spike in the dendritic tuft. B, A weak stimulus (25 μA, 0.1 msec) initiated the spike in the soma-axon region. C, A medium stimulus (30 μA, 0.1 msec) initiated the spike in the trunk of the primary dendrite. D, A medium stimulus (40 μA, 0.1 msec) initiated the spike in the trunk of the primary dendrite of another mitral cell.

