
Figure 6.
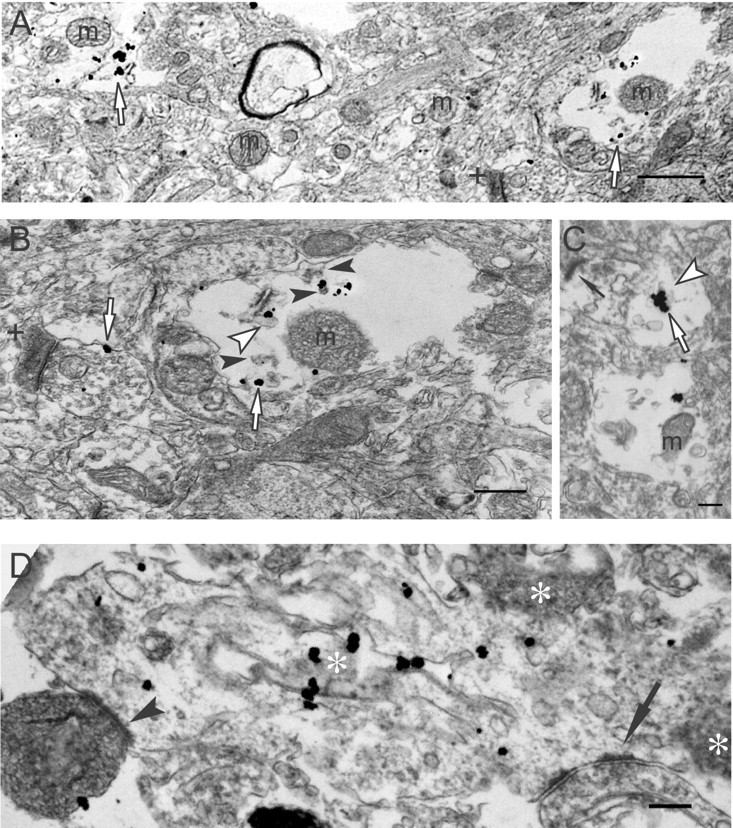
Aβ42 oligomerization within dystrophic processes of human AD brain. A, Aβ42 oligomers (empty arrows) are observed in degenerating neurites and are not associated with more normal-appearing neuropil (middle area of image). A darkened, abnormal-appearing postsynaptic profile is also observed (plus sign). m, Mitochondrion. Scale bar, 1μm. B, A higher-power image of a degenerating neurite in A (A, right empty arrow). Aβ42 oligomers (empty arrows) are associated with a tubulovesicular-like organelle (empty arrowhead) and granular fibril-like electron-dense material (filled arrowheads). Isolated Aβ42 oligomers localize to the membrane of presynaptic profile (left empty arrow) associated with a darkened, degenerating-appearing postsynaptic profile (plus sign). m, Mitochondrion. C, Aggregated Aβ42 oligomers (empty arrow) appear associated with a tubulovesicular-like organelle (empty arrowhead) in a postsynaptic compartment with an active zone (thin arrow). m, Mitochondrion. Scale bar, 300 nm. D, M16 Aβ42 oligomers aggregate on tubular-like membranous structures within a disrupted, swollen dendrite containing abnormal dark profiles (asterisks), consistent with degeneration; no normal organelles can be found in this postsynaptic profile. Presynaptic profiles are seen on the right (arrow) and left (arrowhead) corners of the image; the left one is darkened, indicative of degeneration. Scale bar, 250 nm.