Figure 1.
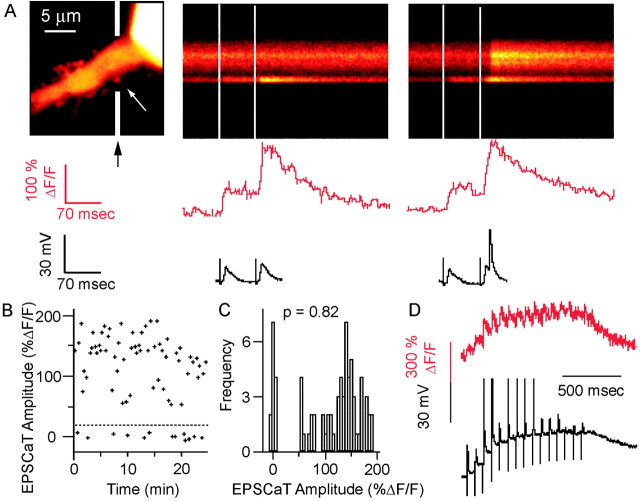
EPSCaTs detect transmitter release at single mossy fiber synapses. A, Left, proximal apical dendritic segment of a CA3 pyramidal neuron in a cultured hippocampal slice, filled with calcium indicator (Oregon Green 488 BAPTA-1). The soma is at the top right; the apical dendrite extends distally to the bottom left. Two line-scan images obtained along the trajectory are indicated by the black arrows, and white line segments are shown in the middle and right panels. Directly beneath each line scan is the Ca2+ signal (red top traces, expressed as fractional change in fluorescence, ΔF/F) from the large spine (thorny excrescence) at the level of the white arrow in the left panel, in response to two afferent stimuli, 70 msec intervals, applied to the dentate granule cell layer. Also shown (bottom traces) is the somatic membrane potential recorded during these stimulus pairs. The precise timing of the stimuli is indicated by the dotted vertical lines in the line scans. The line scans show that EPSCaTs are restricted to the spine, without spread to the dendritic shaft. The second line scan illustrates an action potential in the dendritic shaft slightly after the onset of the second synaptic response. In the false color “thermal” lookup table used in these confocal images, increasing fluorescence is denoted by colors from black through red to yellow and white. B, EPSCaT amplitudes plotted for 73 consecutive trials at 20 sec intervals, illustrating the unambiguous identification of failures (below dashed line) and EPSCaTs, allowing an accurate estimation of pCa, the probability of a stimulus evoking an EPSCaT at the mossy fiber synapse. C, An EPSCaT amplitude frequency histogram constructed from the same 73 consecutive responses, with two distinct distributions: failures (left, centered around 0% ΔF/F) and successful transmission events (right, centered around ∼140% ΔF/F). D, Calcium fluorescence signals (red trace) in a CA3 thorny excrescence in response to repetitive simulation in the dentate granule cell layer (interpulse interval, 70 msec). The simultaneously recorded somatic membrane potential is shown in black. The increment in fluorescence in response to the second stimulus is as large as that from the first, although it rides on top of the first response; the action potential-associated fluorescence transient attributable to the third stimulus is yet larger. Thus, the Oregon Green 488 BAPTA-1 signal is a reasonably linear reporter of EPSCaT amplitudes for ΔF/F up to at least 200%.

