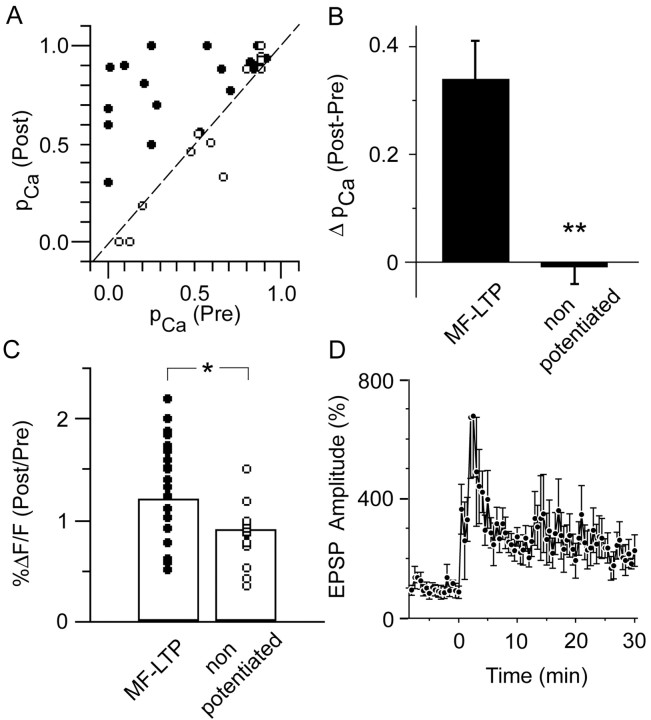
Figure 5.
Changes in optical quantal parameters of transmission at single mossy fiber synapses after the induction of LTP. A, Plot of pCa 30–45 min after LTP induction versus pCa before LTP induction, demonstrating that the probability of a stimulus evoking an EPSCaT was increased in nearly all responding spines in potentiated preparations (filled circles) but not in the tetanized but nonpotentiated control group sampled at corresponding intervals (open circles). Dashed line at 45° represents the null hypothesis of no change in pCa. B, Summary histogram showing the data of (a) plotted as change in pCa, confirming that pCa is significantly increased after LTP induction (*p < 0.005). C, Summary histogram plotting the ratio of EPSCaT amplitudes 30–45 min after LTP induction/before induction (filled circles) compared with the tetanized but nonpotentiated control group (open circles) sampled at corresponding time points. The mean ratio in the potentiated group is >1 and is significantly greater than the mean ratio in the nonpotentiated control group (*), which is <1. Thus, both pCa and EPSCaT amplitude at individual mossy fiber synapses are increased after LTP induction. D, Time course of the mean EPSP amplitude before and after LTP induction in the potentiated group, expressed as percentage of baseline amplitude (n = 6; those cells in which stimulation after LTP frequently evoked spiking are not included here). Error bars in B and D indicate SEM.

