
Figure 6.
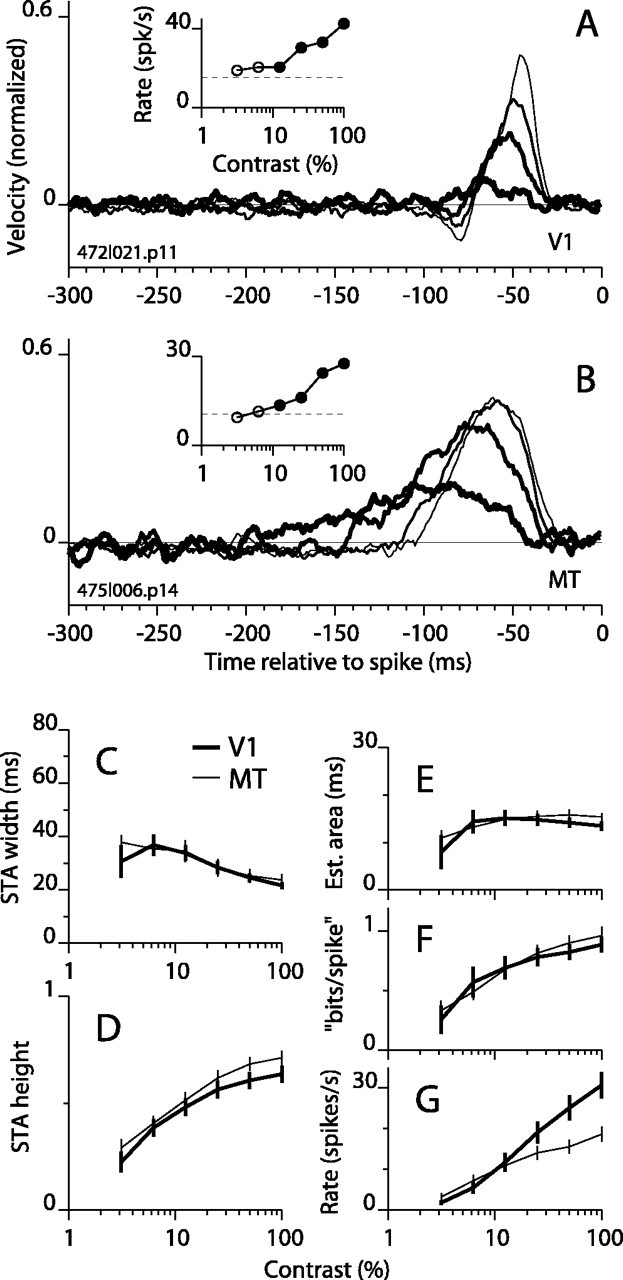
STAs as a function of grating contrast. The format is the same as in Figure 2, except that grating contrast is changing. A, STAs and firing rate for an example V1 cell. Only four of the six contrasts tested yielded STAs with significant peaks. As contrast was reduced from 100% to 12.5% (thinnest to thickest lines), the STA peak height decreased and became slightly broader. B, STAs and firing rates for an example MT cell. As contrast was reduced, there was a substantial broadening of the STA peak in addition to a decrease in amplitude. C-G, Same format as Figure 2, except horizontal axis is contrast.