
Figure 9.
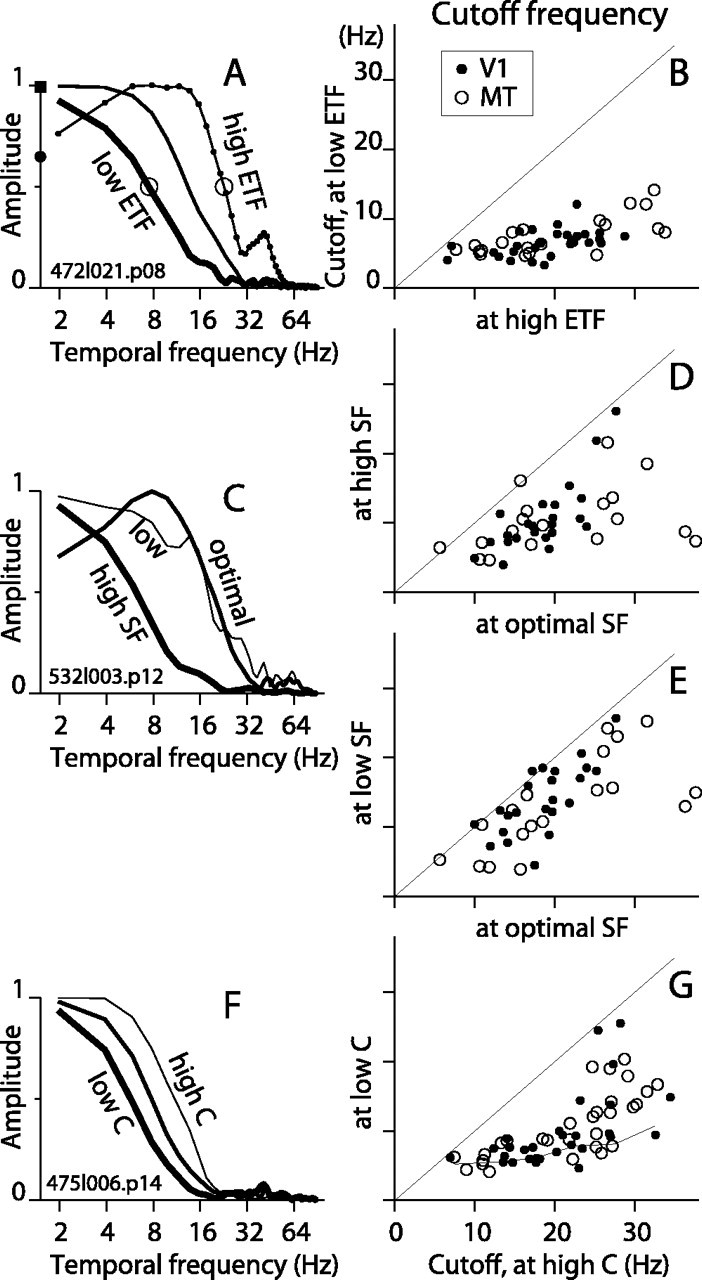
Characterization of STAs in the frequency domain. A, For the example V1 cell in Figure 2A, the amplitude of the FT of the STA is plotted for ETF 0.2, 3.1, and 25 Hz (thick, medium, and thin lines, respectively). The open circles mark the cutoff frequency, defined to be the frequency at which the amplitude drops to half of the maximum value. B, The cutoff frequency for low ETF is plotted against that at ETF 25 Hz for V1 and MT cells (filled and open circles, respectively). The mean cutoff values for V1 (n = 31) were 6 Hz (SD, 2) and 19 Hz (SD, 5) for low and high ETF, respectively, and for MT (n = 21) were 7 Hz (SD, 3) and 21 Hz (SD, 10). C, For the example V1 cell in Figure 3A, the FT of the STAs are plotted for three SF values: 1.0, 2.0, and 7.9 cycles/degree (thin, medium, and thick lines, respectively). D, Cutoff frequency at high SF versus optimal SF for all cells. For V1 (n = 23), the mean cutoff dropped from 19 Hz (SD, 4) at the optimal SF to 10 Hz (SD, 5) at high SF. For MT (n = 18), the mean cutoff dropped from 21 Hz (SD, 9) for optimal SFs to 10Hz (SD, 5) for high SF. E, Cutoff frequency at low SF versus optimal SF. For V1, the mean cutoff was 14 Hz (SD, 5) at lowest SF. For MT, the mean cutoff was 13 Hz (SD, 7). F, For the example MT cell in Figure 6B, the FT of the STAs are shown for contrasts 12.5, 25, and 100% (thick, medium, and thin lines, respectively). G, Cutoff frequency at low contrast versus high contrast for all cells. The mean cutoffs at high contrast were 21 Hz (SD, 7) and 22 Hz (SD, 8) for V1 (n = 26) and MT (n = 29), respectively. At low contrast, the means were 10 Hz (SD, 5) and 11 Hz (SD, 4) for V1 and MT, respectively. For comparison, the thin line plots the mean values of the points from B.