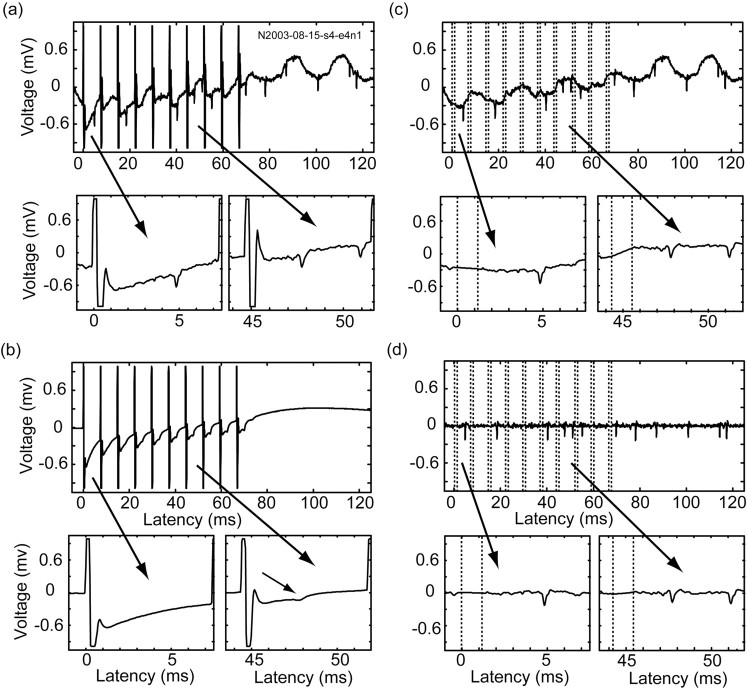
Figure 1.
Stimulus artifact removal process. A sample recording is shown during a train of HFS. The traces are shown throughout the removal process and a magnified view is provided for the times after the first (left) and seventh (right) stimuli. a, Original recorded signal. The 50 Hz artifacts are clearly seen because of the broadband (1-6000 Hz) filter setting. The sequence indicates the number of the neuron with spikes that formed the basis of the figure. b, Mean shapes of the stimulus artifacts were averaged over 600 trains. The short arrow points to the part of the pattern that derives from the locking of the neural response to the stimulus. c, d, The same signal is shown after the artifact pattern removal, before (c) and after (d) digital high-pass (300 Hz) filtering. The dotted lines identify the recording dead time (stimulation parameters: biphasic stimulation; each phase, 0.2 msec/40 μA; 600 trains of 140 Hz; 10 stimuli per train; 500 msec between trains).

