
Figure 3.
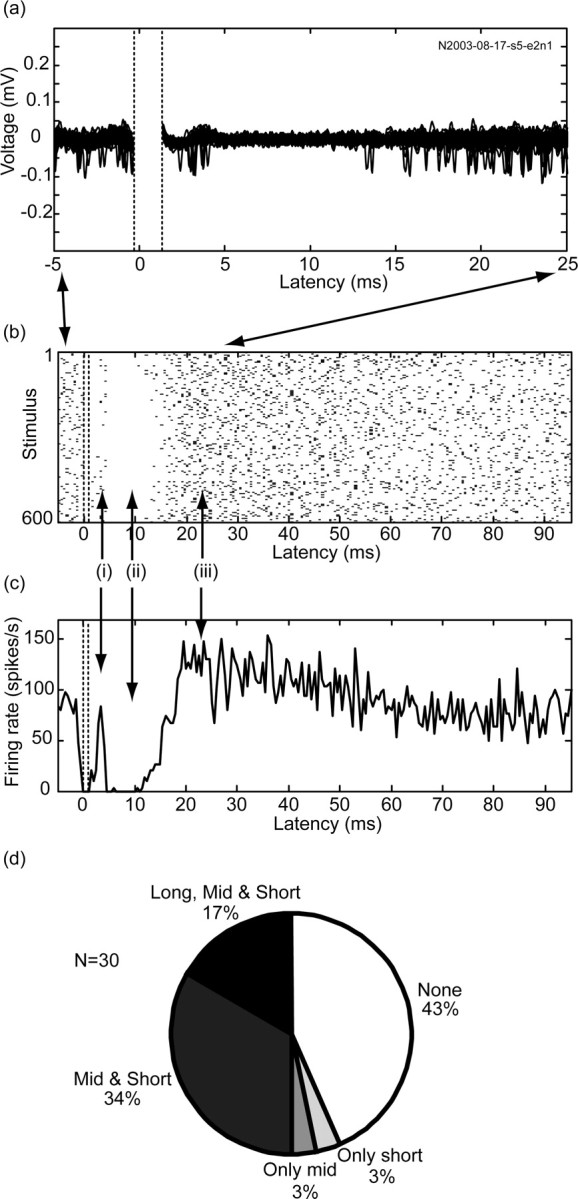
Activity during low-frequency stimulation. Response of a single pallidal neuron is shown as the following. a, An overlay of 50 signal traces (stimulus 400→449) after stimulus artifact removal and filtering. The dead time boundaries are marked by dotted lines. The sequence indicates the number of the neuron with spikes that formed the basis of the figure. b,A raster plot of all repetitions (n = 600). c, A PSTH showing a response consisting of three phases: i, short-term response, ii, mid-term inhibition, and iii, long-term excitation (stimulation parameters: biphasic stimulation; each phase, 0.2 msec/40 μ A; 600 repetitions; 10 Hz). Both the raster and PSTH are in 0.5 msec resolution and aligned to the stimulus. d, Distribution of pallidal responses to low-frequency stimulation.