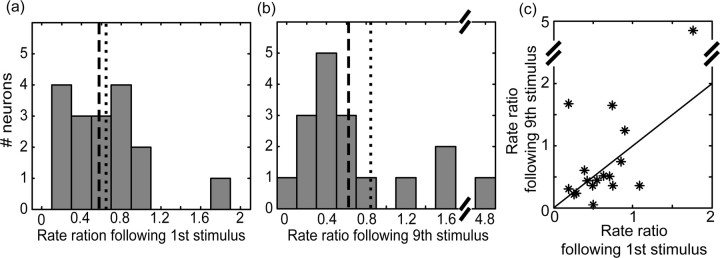
Figure 5.
Changes in firing rate during high-frequency stimulus train. Distribution of the normalized firing rate after the first (a) and ninth (b) stimulus within the train (normalized rate = mean firing rate within the period after the dead time/mean rate before the trains). The mean rate is shown as a dotted line, and the mean rate after removal of the outlier is shown as a dashedline. c, The ratio of the normalized rates after the first and ninth stimuli; the diagonal marks a ratio of 1.

