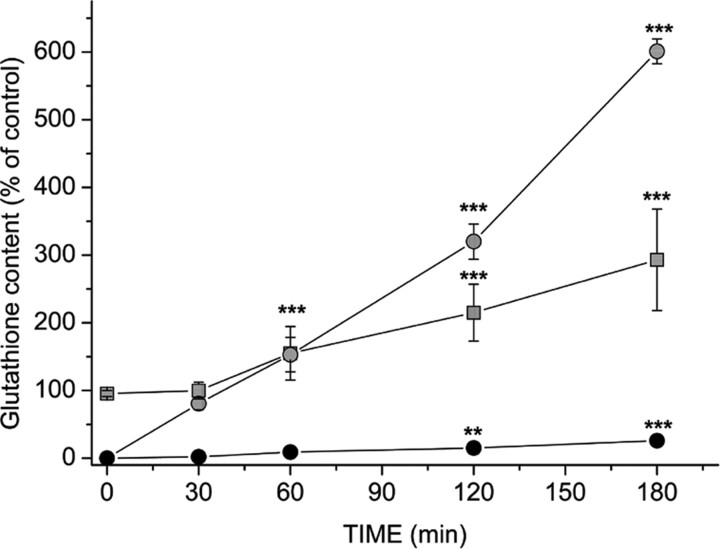
Figure 3.
Recovery of mitochondrial glutathione after treatment with 100 μm ethacrynic acid for 15 min. The slow spontaneous restoration of mitochondrial glutathione during incubation in HBSS alone is shown (•) and compared with rapid recovery in the presence of 5 mm glutathione monoethylester ( ). Treatment with the glutathione ester also increased cytoplasmic glutathione content (
 ), but the changes were slower to develop and less pronounced than those in the mitochondria. Values are shown as mean ± SD. **p < 0.01 and ***p < 0.001, compared with glutathione content measured after 15 min of treatment with 100 μm ethacrynic acid (one-way ANOVA with Student-Newman-Keuls test; n = 15). Control (100%) values were 1.0 ± 0.1 nmol of glutathione per milligram of mitochrondrial protein in the mitochondria and 27 ± 2 nmol of glutathione per milligram of cell protein in the cytoplasm.

