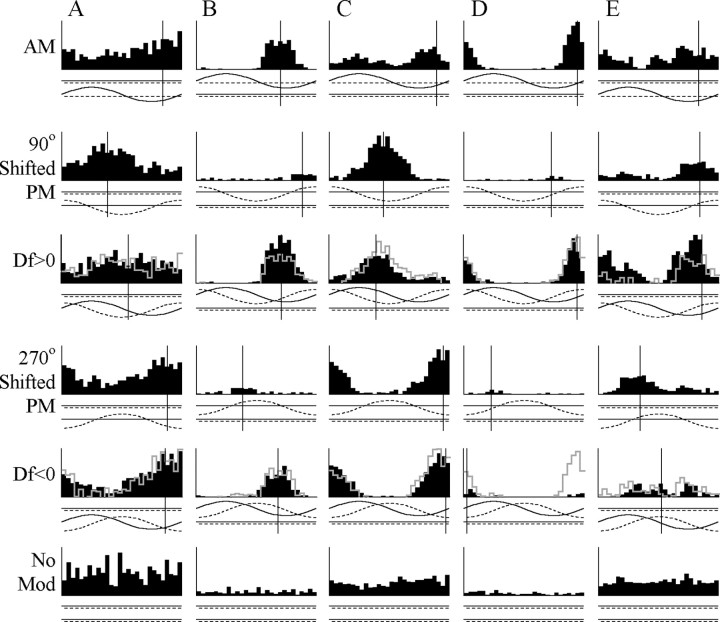
Figure 5.
Examples of nonlinear responses in combination-sensitive units. Response histograms are shown in black, and the expected linear summation of AM and PM responses for Df >0 and Df <0 are shown in gray. Two histograms are shown for the PM responses of each unit, one shifted by 90° to align the response with the Df >0 stimulus and one shifted by 270° to align the response with the Df <0 stimulus. Note that these two histograms are identical except for their time bases. A, An E/advance-type unit that showed a linear summation for both signs of Df and is nonselective (t40 = 0.01; p > 0.98). Vertical scale, 54 spikes/sec. B, An I/delay-type unit that was Df >0 selective (t166 = 12.2; p < 0.000000001), resulting from facilitation in response to Df >0, and a linear combination in response to Df <0. Vertical scale, 102 spikes/sec. C, An E/advance-type unit that was Df <0 selective (t166 = 4.71; p < 0.0001), resulting from suppression in response to Df >0, and a linear combination in response to Df <0. Vertical scale, 150 spikes/sec. D, An E/delay-type unit that was Df >0 selective (t82 = 12.7; p < 0.000000001), resulting from suppression in response to Df <0, and a linear combination in response to Df >0. Vertical scale, 93 spikes/sec. E, An E/delay-type unit that was Df >0 selective (t82 = 13.6; p < 0.000000001), resulting from facilitation in response to Df >0, and suppression in response to Df <0. Vertical scale, 90 spikes/sec. No Mod, No modulation.

