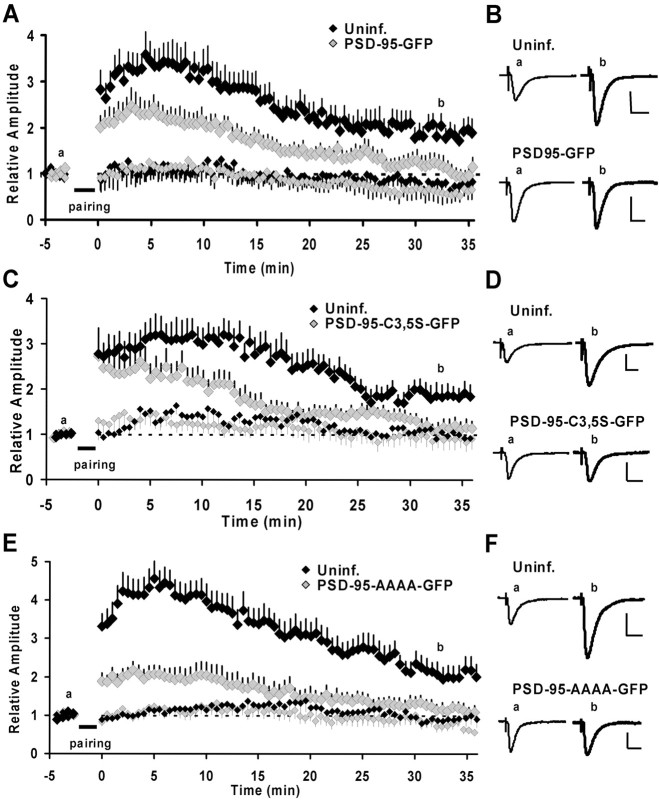
Figure 5.
Expression of wt PSD-95 occludes and expression of putative dominant negative forms of PSD-95 blocks LTP. A, C, E, Time courses of relative changes in AMPA-mediated EPSCs by pairing-induced LTP for control and infected neurons. Induced (paired) pathways are shown in large and control (unpaired) pathways in small symbols for infected and control neurons. The time of delivery of the pairing protocol is indicated by the bar. A, Expression of PSD-95–GFP-occluded LTP. Transmission onto infected neurons returned almost to baseline 30–35 min after pairing (1.17 ± 0.20; n = 12) and was significantly different from the potentiation observed in control neurons (1.88 ± 0.22; n = 13; p = 0.028; t test). Ci Expression of PSD-95C3,5S–GFP blocked LTP. In PSD-95C3,5S–GFP-expressing neurons, transmission returned almost to baseline levels 30–35 min after pairing (1.17 ± 0.16; n = 10). This was significantly different from potentiation in the control neurons (1.89 ± 0.23; n = 7; p = 0.02; t test). E, Expression of PSD-95AAAA–GFP blocked LTP. In infected neurons, transmission returned close to baseline levels 30–35 min after pairing (1.21 ± 0.15; n = 11), which was significantly different from control neurons (2.10 ± 0.29; n = 11; p = 0.014; t test). B, D, F, Example traces of EPSCs in uninfected and infected neurons before and ∼32–35 min after pairing. Traces are the averages of 30 sweeps. Calibration: 40 pA, 20 msec.

