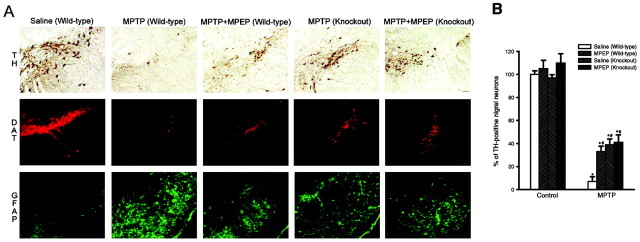
Figure 2.
A, Immunohistochemical analysis of TH, DAT, and GFAP in the substantia nigra pars compacta of wild-type and of mGlu5 knock-out mice treated as in Figure 1. Scale bar, 50 μm. B, Values in the graph (means ± SEM) are expressed as a percentage of controls (wild-type mice treated with saline) and were calculated by counting the number of TH+ neurons of the pars compacta of the substantia nigra from four comparable sections from five to six mice per group. *p < 0.05 (one-way ANOVA plus Fisher's PLSD) versus the respective control mice treated with saline. #p < 0.05 (one-way ANOVA plus Fisher's PLSD) versus wild-type mice treated with MPTP and saline.

