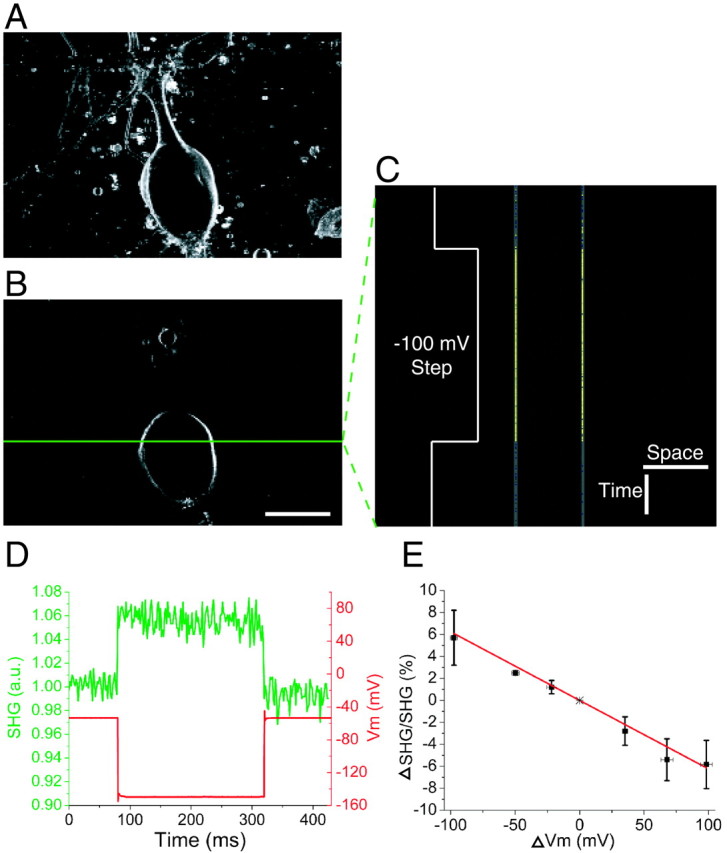
Figure 1.

Line-scan recording of Vm with SHG during voltage steps in cultured Aplysia neurons. A, Projection image superimposing 21 ∼1-μm-thick z-sections 2 μm apart. B, A single z-section through the neuron in A at the plane of line scanning. The green line represents the scanned line where membrane potentials are recorded. C, SHG signal changes recorded by line scanning the line denoted in B at 600 lines/sec. The voltage-clamped neuron was given a 240 msec duration –100 mV step after 80 msec of scanning during each line scan. n = 50 line scans were averaged. The line scan image is scaled to visualize the small change in SHG emission. Calibration: 50 μm, 50 msec. D, The green trace, obtained from the left membrane line in C, is a normalized intensity plot of SHG emission versus time. The red line represents the measured Vm during the voltage-clamp step. a.u., Arbitrary units. E, Plot of ΔSHG/SHG over physiologically relevant ΔVm. The functional fit in red shows a linear relationship. Error bars represent SDs of three to five different measurements at each ΔVm ±∼4 mV. Note the inverse relationship between ΔSHG/SHG and ΔVm.
