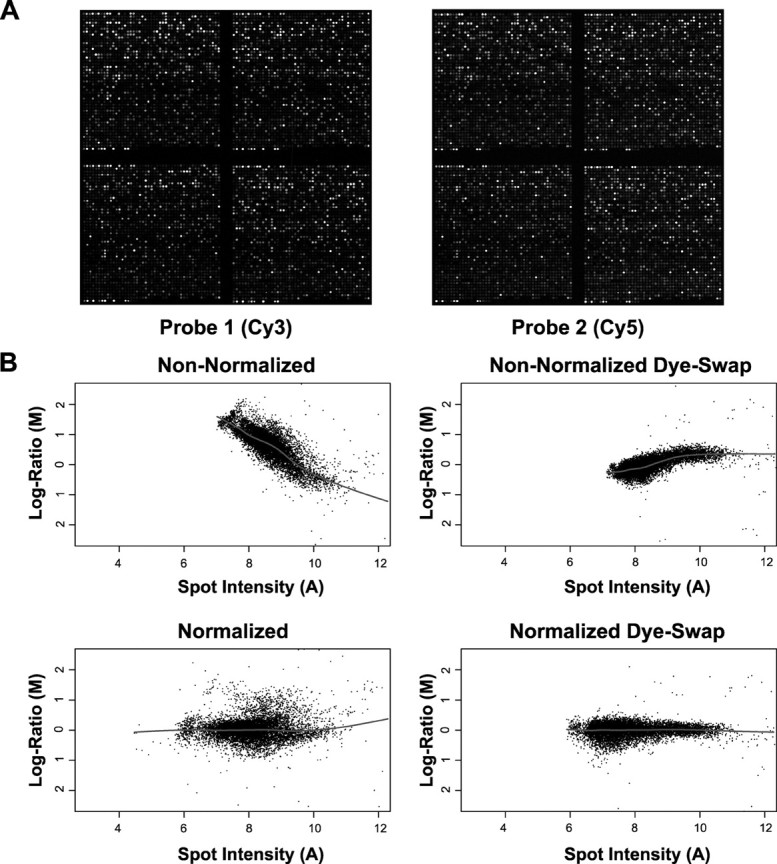
Figure 3.

Differential expression in the dentate. A, TIFF images from both active caspase 3(+)/TUNEL(+) granule neurons (Cy3) from an injured brain and nonlabeled granule neurons from an uninjured brain (Cy5). Each channel is segmented and analyzed to extract the intensity and background values for every spot on the array. B, The resulting data are then plotted on log ratio (M = log2 Cy3/Cy5) versus overall spot intensity [A = log2√(Cy3 × Cy5)] to assess effectiveness of normalization of the dye biases and to calculated the differential expression.
