
Figure 4.
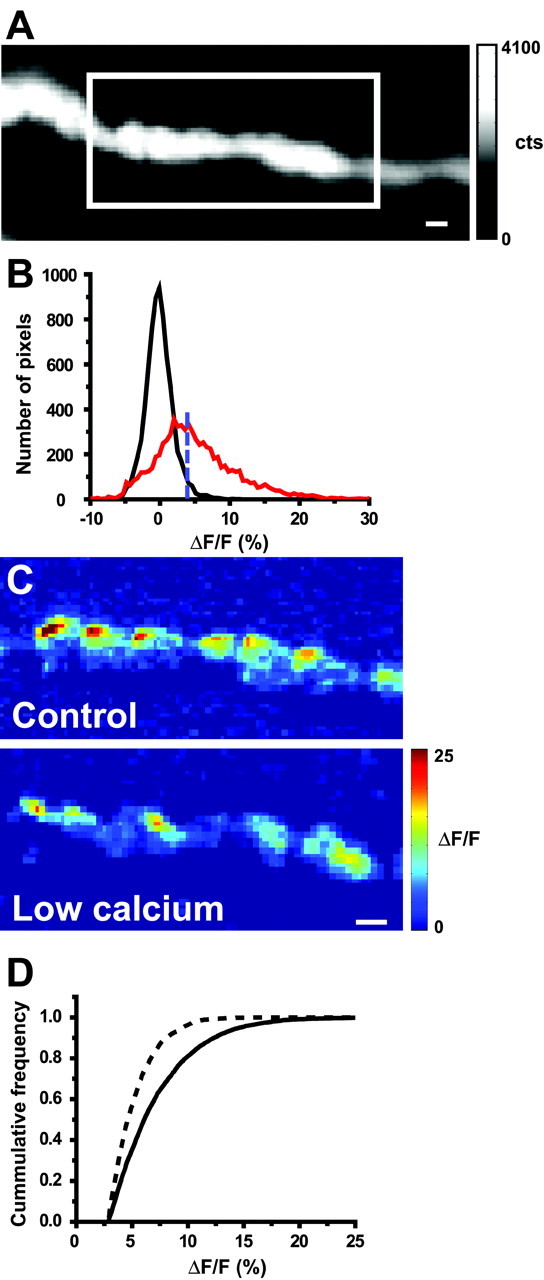
Effects of 5 min exposure to low Ca2+ saline on Ca2+ entry after nerve stimulation. A, Sample resting fluorescence image of the nerve terminal (gray-scale bar in photoelectron counts) with the well focused region of interest defined by the white box. B, Histogram showing the distribution of pixel intensities in the presence and absence of nerve stimulation as described in Figure 1 E. C, Representative difference images in normal Ca2+ (1.8 mm; top panel) and after exposure to 0.5 mm Ca2+ (bottom panel). Pseudocolor scale bar applies to both images and is expressed as ΔF/F (%). D, Cumulative frequency distribution of pixel intensity values measured before (solid line) and after (dashed line) exposure to 0.5 mm Ca2+. In three terminals examined in this manner, there was consistently a significant leftward shift (toward lower intensities) in the distribution of pixel intensities. Scale bars, 2 μm.