
Figure 8.
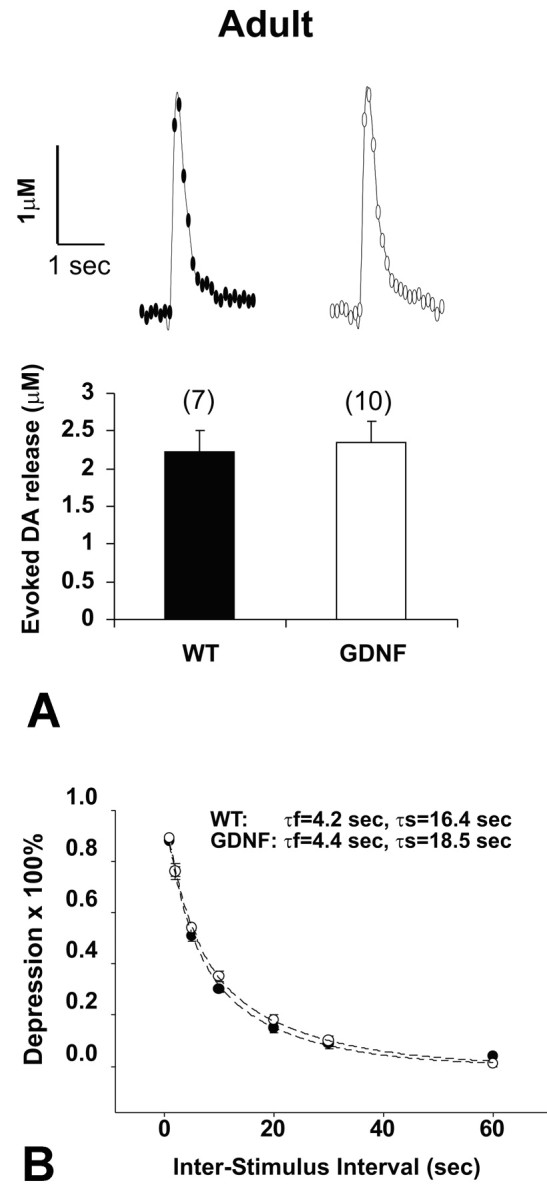
Electrically evoked DA release in striatal slice preparations was measured using fast-scan CV. A, Representative CV recording traces in response to a single pulse stimulus and the averaged peak DA responses. DA release in response to a single pulse stimulus did not differ significantly between genotypes in adult animals or in pups at PND 13–15 (data not shown). The numbers of slices for the paired group (WT, filled bar; CBLG-DT, open bar) are indicated in parentheses. B, Paired pulse depression was not altered in CBLG-DT mice. Paired electrical stimuli were applied at variable interpulse intervals (1, 2, 5, 10, 20, 30, and 60 sec). Average time courses for recovery of the peak DA response are presented as percent depression of the second stimulus response relative to the first [100 × (1 sec peak amplitude/first peak amplitude)] in WT and CBLG-DT mice (5 slices each from 5 pairs of the adult group). Data were fitted by double-exponential functions (dashed lines) in the form of y = 0.5 × exp (–t/τf) + 0.5 × exp (–t/τs).