
Figure 2.
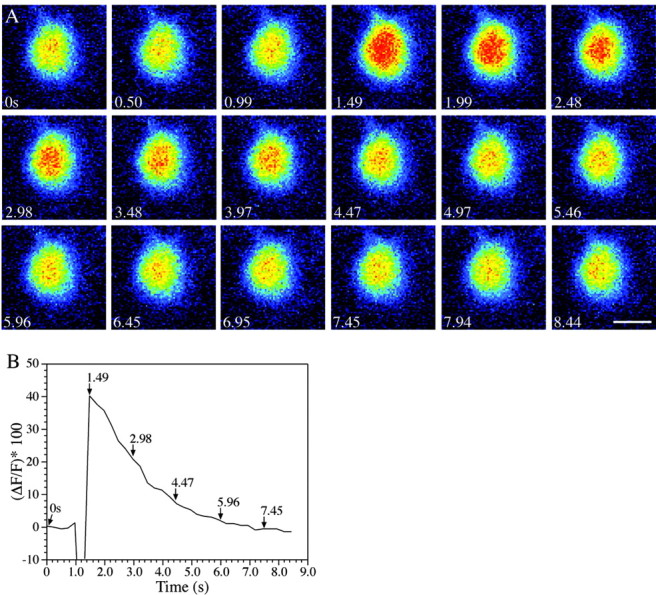
An ectopic r2 Mauthner cell responds to startle stimuli. A, A time series of images progressing left to right across rows beginning at time point 1 shows that the cell responds (1.49 sec), as indicated by increasing orange and red pixels; a pseudocolor demonstration of increasing brightness of fluorescence was applied by LSM 510 software (Zeiss). After the response, calcium is sequestered, and the cell returns to its resting fluorescence levels, as shown in the second and third rows. Scale bar, 10 μm. B, The r2 Mauthner cell responds to startle stimulation. Calcium green dextran (MW of 10,000; Molecular Probes) was used to visualize the response of the r2 M-cell to a touch–startle stimulus. The graph shows the percentage change in cell brightness through the duration of the response (time in seconds). Times indicated by arrows refer to image times in Figure 1C. The initial decrease in brightness after the stimulus was attributable to movement artifact from the attempted startle. There is an ∼40% change in the brightness of the r2 Mauthner cell in response to touch–startle stimulation.