
Figure 5.
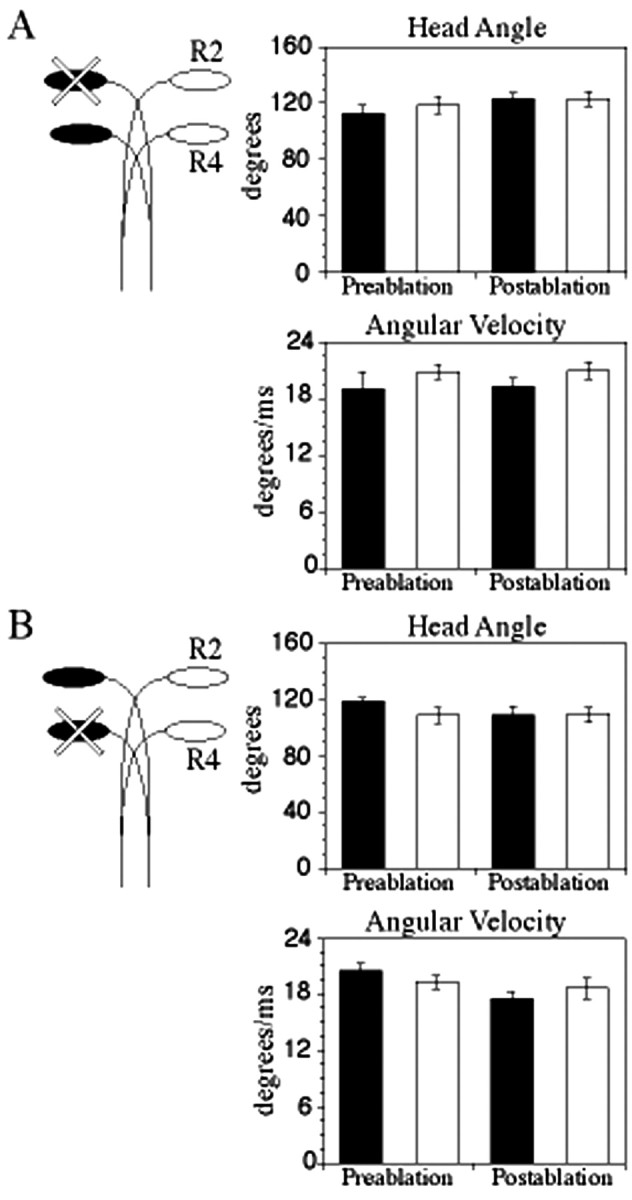
Startle kinematics before and after either r2 or r4 Mauthner cell lesions. On the left, diagrams of Mauthner cell arrangement illustrate which cell or cells were lesioned. Turns toward the side that normally receives input from the ablated side are illustrated with black bars; turns toward the opposite side are illustrated with white bars. There was no significant difference in postablation turns when either the r2 or the r4 Mauthner cell was ablated. Means and SE for treatments are shown in Table 1.