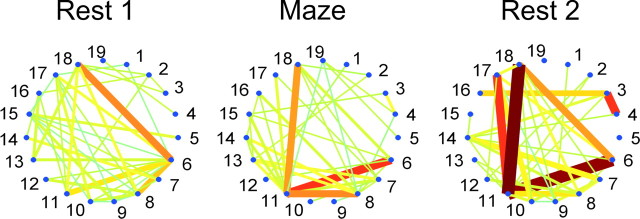
Figure 2.
Example of reactivation in a session recording 19 units. For each main episode, cell numbers are plotted along the perimeter of a circle. If a correlation for any given cell pair was significant (p < 0.001), a straight line was plotted between those two cells (color scale: yellow-red is positive, blue is negative). Line thickness is proportional to the absolute correlation magnitude (dark red bar corresponds to a maximal correlation value of +0.16). During REST1, relatively strong correlations are found between (5,15), (6,8), (6,11), (6,17), (6,18), (7,14), (8,12), and (11,18). Some of these correlations, such as (6,11), (6,18), and (11,18), are present throughout all episodes and thus do not contribute to specific REST1-MAZE similarity. During MAZE, some correlations from REST1 disappear, such as (5,15), (6,17), and (7,14), and new correlations appear [e.g., (3,4), (8,11) and (8,14)]. During REST2, some correlations newly recruited during MAZE reappear [e.g., (3,4), (8,11), (8,14)]. Some correlations are present only during REST1 and REST2 [e.g., (8,12) and (10,17)] and do not specifically influence reactivation measures. Overall, the similarity between REST2 and MAZE patterns was larger than between REST1 and MAZE patterns.

