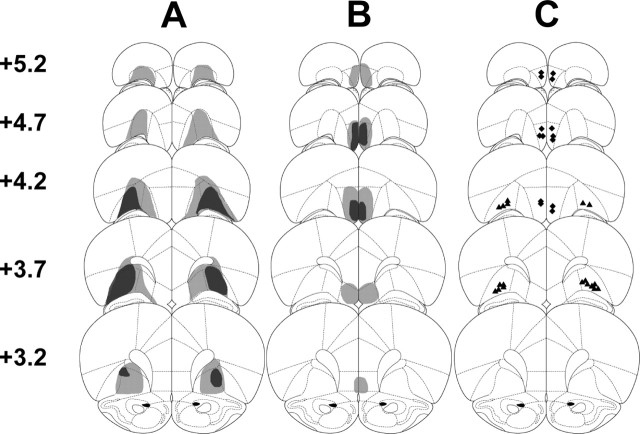
Figure 2.
Schematic representation of the largest (light shaded areas) and smallest (dark shaded areas) lesions and of cannula placements for the lOFC (A, C) and mOFC (B, C) lesion experiments. Triangle and diamond symbols represent the most ventral point of the injection cannula tracks of the lOFC and mOFC sham control animals, respectively. The numbers represent the approximate distance (in millimeters) from bregma, based on the atlas of Paxinos and Watson (1997).

