Figure 2.

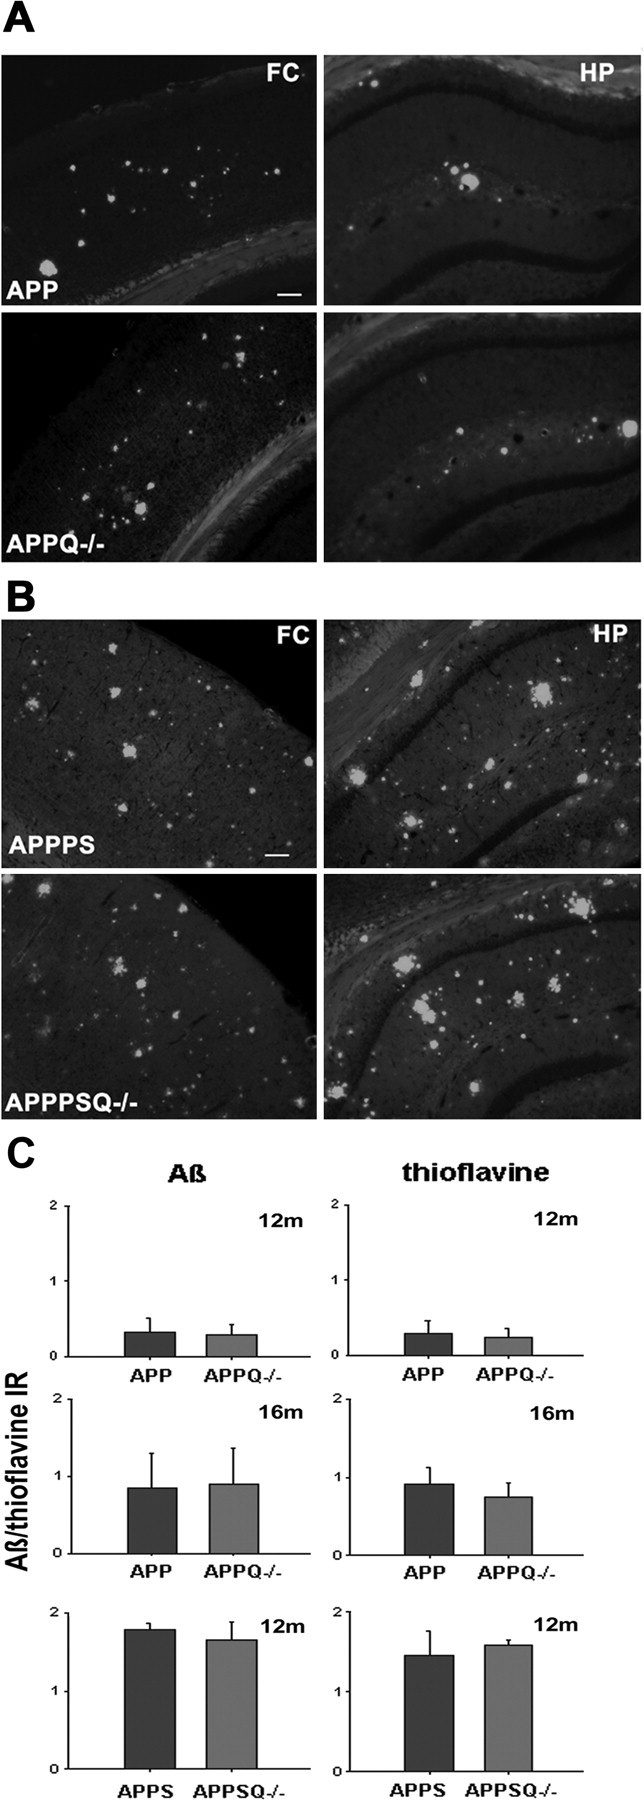
Comparable levels of Aβ and thioflavine reactivity in APP and APPQ-/- transgenic models. A, B, Representative images of thioflavine staining in frontal cortex (FC) (left) or hippocampus (HP) (right) in APP (top) and APPQ-/- (bottom) at 16 months (A) or APPPS (top) and APPPSQ-/- (bottom) at 12 months (B). Scalebar, 100 μm. C, Image analysis of Aβ (left panels) and thioflavine (right panels) staining in cortex and hippocampus performed as described in Materials and Methods. Values from multiple images of each section that cover most to all the region of study were averaged per animal per experiment. The mean value per animal (average of 2-3 experiments, total of 3-6 sections) was used to obtain the mean of the genotype. Bars represent genotype mean ± SD from n mice per genotype; APP/APPQ-/-: n = 6 at 16 months and n = 3 at 12 months per each genotype; APPPS/APPPSQ-/-: n = 2 at 12 months per genotype.
