Figure 3.

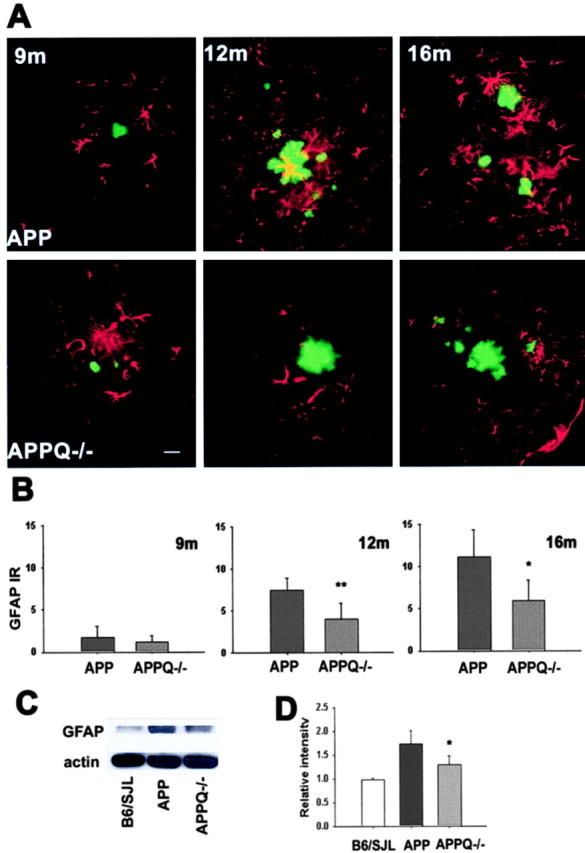
Decrease in astrocytic reactivity around fibrillar Aβ in APPQ-/- at 12 and 16 months of age. A, Fluorescent GFAP (red)/thioflavine (green) colocalization in cortex of APP (top) and APPQ-/- (bottom) mice at 9 months (left), 12 months (middle), and 16 months (right). Note that the APPQ-/- mouse has less GFAP staining around thioflavine positive plaques (of comparable area to the APP). Scale bar, 20 μm. B, Quantification of GFAP immunoreactivity associated with plaques in APP and APPQ-/- at 9, 12, and 16 months by image analysis (see Materials and Methods). Mean value of each animal per genotype is the average of values from two to three experiments (total of 3-6 sections) in which most to all the region of study was analyzed in each section. Bars represent group means ± SD from n mice per genotype; n = 6 at 12 and 16 months and n = 3 at 9 months per each genotype. *p < 0.02, **p < 0.007 by single-factor ANOVA test comparing APP and APPQ-/-. C, Representative Western blot of GFAP and β actin in brain lysates of B6/SJL, APP, and APPQ-/- mice at 16 months. D, Densitometric quantification of GFAP protein levels in immunoblots of B6/SJL (n = 2), APP (n = 4), and APPQ-/- (n = 4). Values were expressed relative to control [wild-type (WT)] levels. Bars represent group means ± SD of n mice per genotype. *p < 0.05 by single-factor ANOVA test comparing APP and APPQ-/-.
