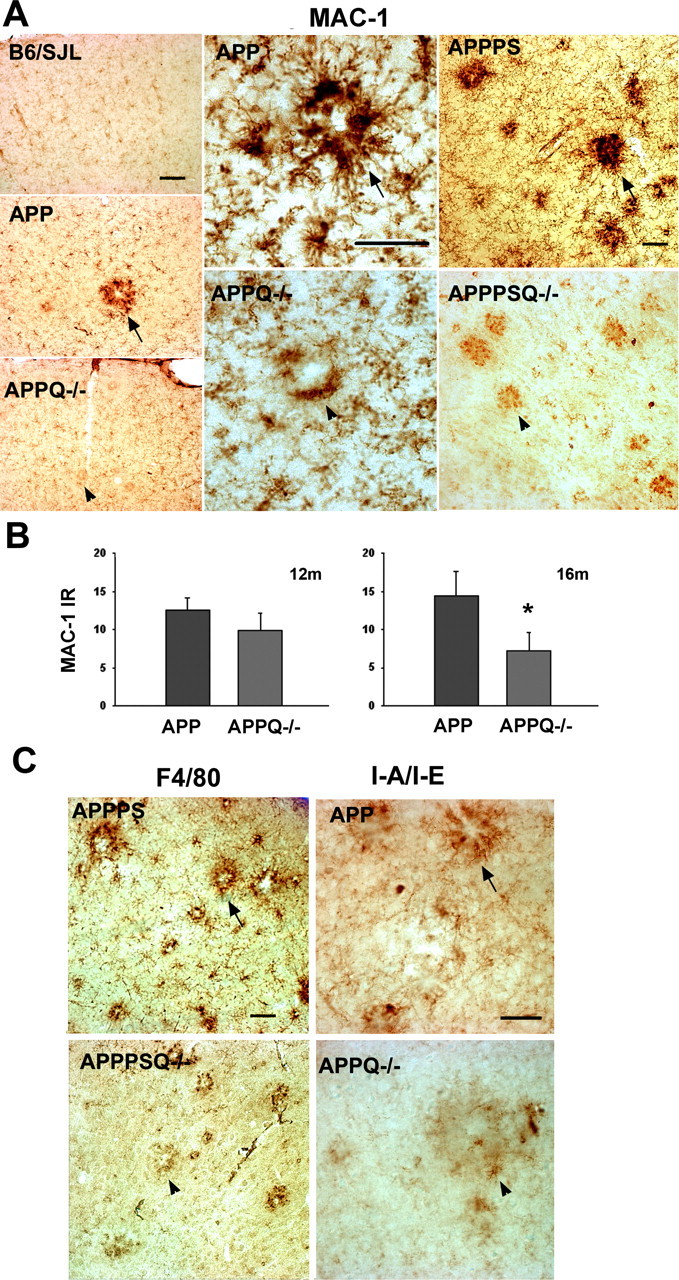
Figure 4.

Lower microglial activation is seen in the proximity of plaques in the APPQ-/- and APPPSQ-/- mice. A, Representative pictures of MAC-1 immunostaining in cortex of 16 months B6/SJL, APP, and APPQ-/- (left panels), in 16 months APP and APPQ-/- plaque area (middle panels), and in cortex of 12 months APPPS and APPPSQ-/- (right panels). Note the decreased MAC-1 immunoreactivity in the area surrounding the plaque of the APPQ-/- or APPPSQ-/- mice (arrowheads) compared with the Q+/+ genotype (arrows). Scale bars: left panels, 100 μm; middle and right panels, 50 μm. B, MAC-1 area percentage associated with plaques in the APP and APPQ-/- mice at 12 and 16 months. Values from multiple images of a section that cover most to all the region of study were averaged per animal per experiment The mean value per animal (average of 2-3 experiments, total of 3-6 sections) was used to obtain the mean of the genotype. Bars represent genotype mean ± SD from n mice per genotype; n = 6 at 16 months and n = 3 at 12 months per each genotype. *p < 0.003 by single-factor ANOVA. C, Representative pictures of other microglial markers F4/80 and I-A/I/E in APPPS, APPSQ-/-, APP, and APPQ-/- animals also showing decreased immunoreactivity in the Q-/- genotypes. Scale bar, 50 μm.
