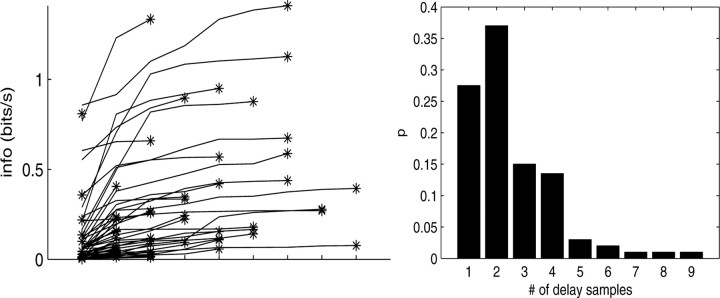
Figure 4.
Information captured as a function of number of delay samples. Top, Each trace corresponds to the information versus number of delay samples for a single cell; asterisk denotes optimal number of delays. Only a randomly chosen subsample of cells is shown here, to avoid overcrowding. Bottom, Histogram of minimal number of filter delays per cell necessary to capture information in full preferred trajectory  .
.

