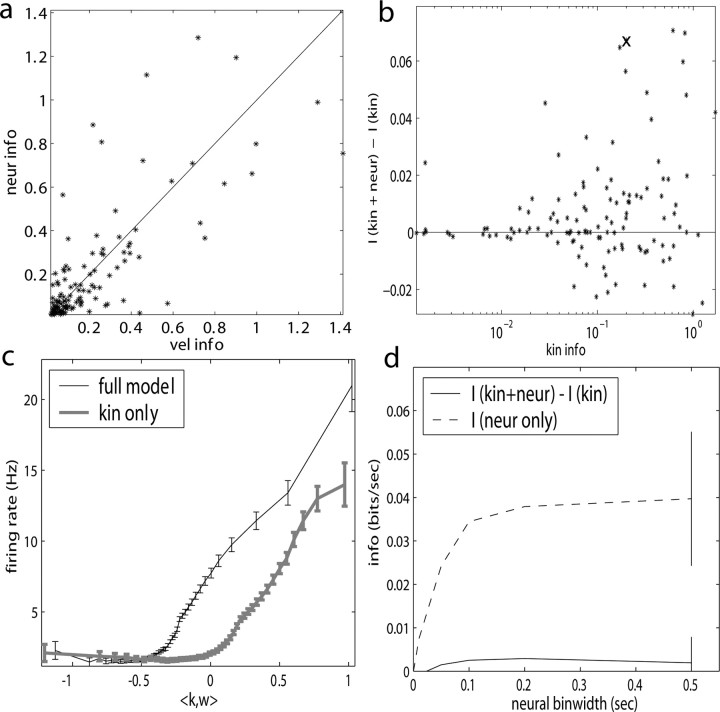
Figure 9.
Observing neighbor activity increases the predictability of MI neurons. a, Comparison of information values for neural-only (no kinematic input;  ) versus velocity-only (no neural input;
  ) models. Conventions as in Figure 2; for fair comparison, information values here are based on the largest bin width shown in d, 500 msec. b, Comparison of information values for full model (kinematic data
  augmented with neighboring neural activity
  ) versus kinematic-only model (
 ). Significantly more points fall above the equality line (one-sided t test; note logarithmic scale used to expose structure in scatter plot here). c, Estimated encoding functions f for kinematic-only (gray trace) versus full model (black). Note the differences in dynamic range of two curves. Cell illustrated here is marked with an “x” in b. d, Effects of bin width on network informativeness in the presence of kinematic information [
 nonzero; solid trace is median ± SE information difference
  over all cells, plotted against bin width used to define ni] and without [dashed trace is
  , i.e.,
  ].
].

