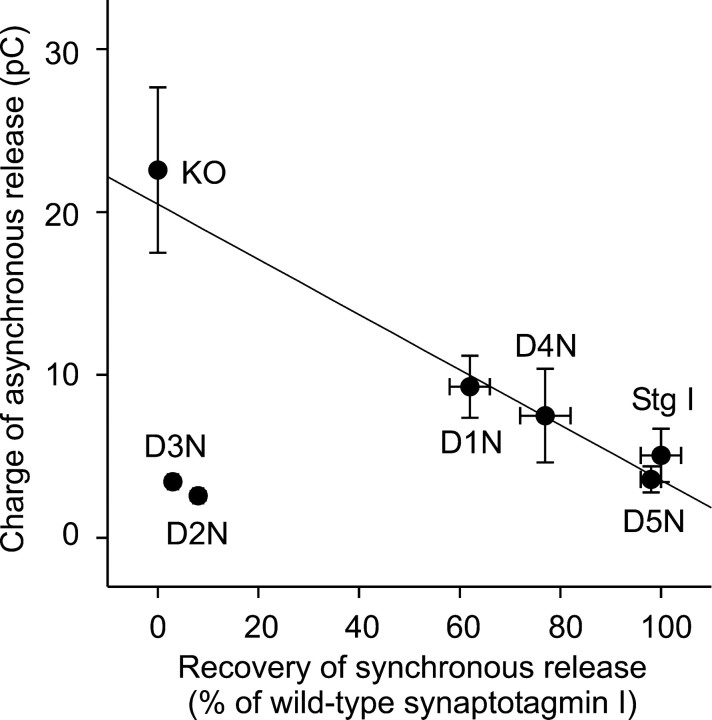
Figure 6.
Inverse relationship between synchronous and asynchronous transmitter release. The relative amount of synchronous release measured for neurons expressing each type of synaptotagmin I mutant, as well as knock-out neurons, was normalized by the value measured for wild-type synaptotagmin I. The absolute amounts of asynchronous release were calculated from the product of the relative amplitude of this component (Fig. 5C) and total EPSC charge (Fig. 4 B). Data are mean ± SEM. Straight line is a linear regression fit to all data points except for those for D2N and D3N.

