Figure 5.
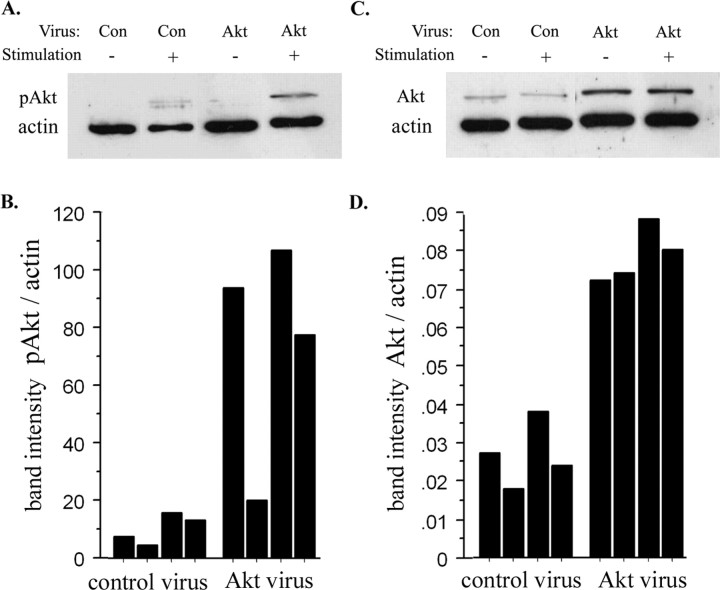
Elevated Akt-1 expression enhanced Akt activation. E13.5 cortical progenitors were infected with control or Akt-1 viruses, cultured in EGF, as in Figure 4, and selected in G418 to obtain cultures enriched for infected cells. After 10 d, neurospheres were collected in serum-free, growth factor-free medium. Four hours later, half of the cells were stimulated with a mixture of EGF, FGF2, and insulin for 30-60 min. A, Representative Western blot, probed with antibodies to pAkt and actin. B, Summary of pAkt expression relative to actin, comparing control and Akt-infected cells in four sets of cultures. The mean difference in pAkt level (relative to actin) after stimulation was 10.2 ± 2.5 versus 74.4 ± 19.1, control-infected versus Akt-infected lysates (p = 0.03). C, Representative blot probed with Akt and actin antibodies. D, Summary of Akt expression (normalized to actin) comparing Akt-infected cells to control-infected cells in four sets of cultures. The mean difference in Akt expression (relative to actin) was 0.03 ± 0.004 versus 0.08 ± 0.004, control versus Akt (p = 0.0003).

