
Figure 2.
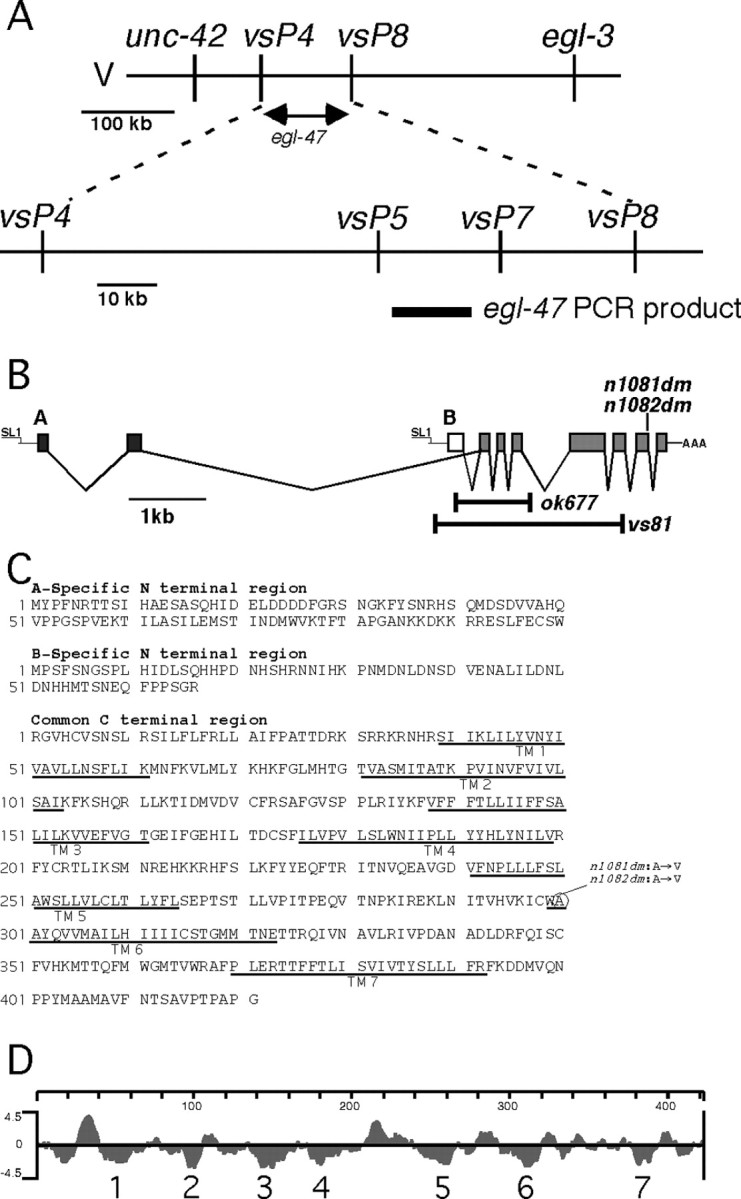
egl-47 mapping, exon structure, protein sequence, and hydrophilicity plot. A, Mapping and cloning strategy for egl-47. The top line schematizes the genetic positioning of egl-47 between single-nucleotide polymorphisms vsP4 and vsP8. The bottom line shows additional polymorphisms that were not separated from egl-47 by seven recombination events within this interval. The thick bar under the bottom line represents a PCR product that contains egl-47. When amplified from the n1081dm gain-of-function mutant and transformed into wild-type animals, this PCR product induced the egl-47 egg-laying defect. B, egl-47 gene structure and locations of mutations. Black boxes represent A-specific exons; the white box represents the B-specific exon; the gray boxes indicate exons common to both isoforms. The SL1 trans-splice leaders and poly(A) tail found at the ends of the transcripts are indicated. Bars indicate deleted regions of probable null alleles vs81 and ok677. C, Protein sequence of the A-specific region, B-specific region, and common region. Predicted transmembrane domains are underlined. The circle indicates the amino acid residue altered in dominant mutants n1081dm and n1082dm. D, Kyte-Doolittle hydrophilicity plot of the common region. Seven predicted transmembrane domains are indicated.