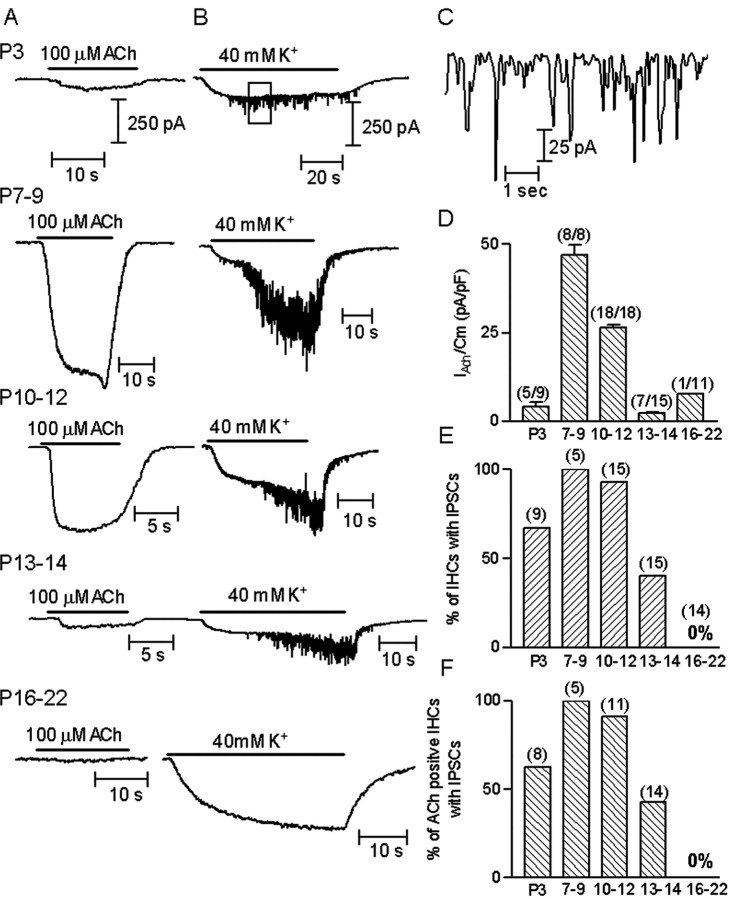
Figure 1.
ACh-evoked currents and K+-evoked IPSCs in IHCs throughout development. A, Representative records of currents (nAChR + SK) evoked by 100 μm ACh in IHCs voltage-clamped at -90 mV at the different postnatal ages. B, Representative records of currents evoked by 40 mm external K+ (at -90 mV). Note that at P16-P22, 40 mm K+ produced the expected change in the holding current but no IPSCs. Responses shown in A and B at each age were taken from the same IHC. C, Synaptic currents enclosed by box shown in B (top record), plotted at a slower time scale. D, Bar diagram illustrating the mean amplitude ± SEM of the currents evoked by 100 μm ACh, normalized to the mean capacitance (Cm) at each age group. Numbers between brackets are the number of cells in which 100 μm ACh elicited a current per number of cells tested. The mean amplitude includes only the ACh-positive cells. Amplitudes at P3 and at P13-P14 were significantly different from those at P7-P9 (p < 0.0019). Mean capacitance values used to normalize amplitudes were (in picofarads, mean ± SEM): P3, 10.4 ± 0.7; P7-P9, 9.5 ± 0.4; P10-P12, 10.0 ± 0.4; P13-P14, 12.6 ± 0.6 and P16-P22, 13.0 ± 1.0. E, Bar diagram representing the number of IHCs that had IPSCs after superfusing the preparation with saline containing 40 mm K+. Numbers between brackets are the number of cells studied at each age group. F, Bar diagram illustrating the fraction of Ach-sensitive IHCs that also had K+-evoked IPSCs at the different postnatal ages studied. Numbers between brackets are the number of cells positive to ACh that were superfused with high potassium to evaluate synaptic activity. In all cases the intracellular solution contained KCl and EGTA.

