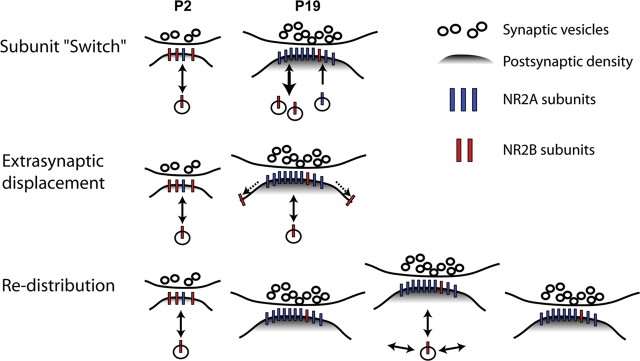
Figure 8.
A schematic diagram summarizes three potential models for the switching of NR2A and NR2B subunits at developing synapses. Subunit “Switch” (model 1) results from a dramatic increase in synaptic NR2A (short blue bars) and concomitant decrease in synaptic NR2B subunits (short red bars) caused by reciprocal changes in the expression of NR2 subunits. Extrasynaptic displacement (model 2) results in a progressive shift of NR2B subunits from synaptic sites to extrasynaptic sites accompanying an increase in NR2A at synapses. Redistribution (model 3) in which a dilution of synaptic NR2B subunits is caused by a developmental increase in synapse number with an increase in NR2A expression but without similar increases in NR2B cellular expression.

