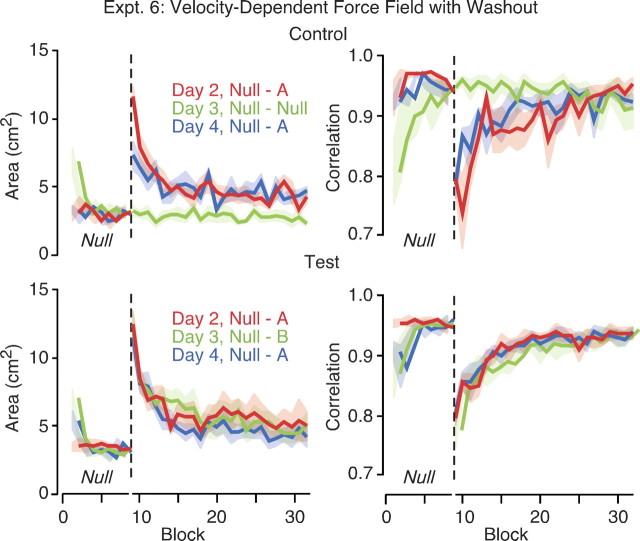
Figure 6.
Adaptation to velocity-dependent force fields with the arm supported. Curves in the left panels show mean area enclosed by the hand path as a function of block on different days. Curves in the right panels show the vector correlation measure (see Materials and Methods for details) as a function of block on different days. Curves to the left of the dashed vertical line show performance in null trials performed at the start of each session. The height of the shaded areas represents ±1 SE. The top panel shows results for the control group who adapted to the same force field A on days 2 and 4 and experienced a full set of null trials on day 3. The bottom panel shows results for the test group who adapted to A on days 2 and 4 and the opposing force field B on day 3. Both groups trained on a full set of null trials on day 1 (data not shown).

