
Figure 2.
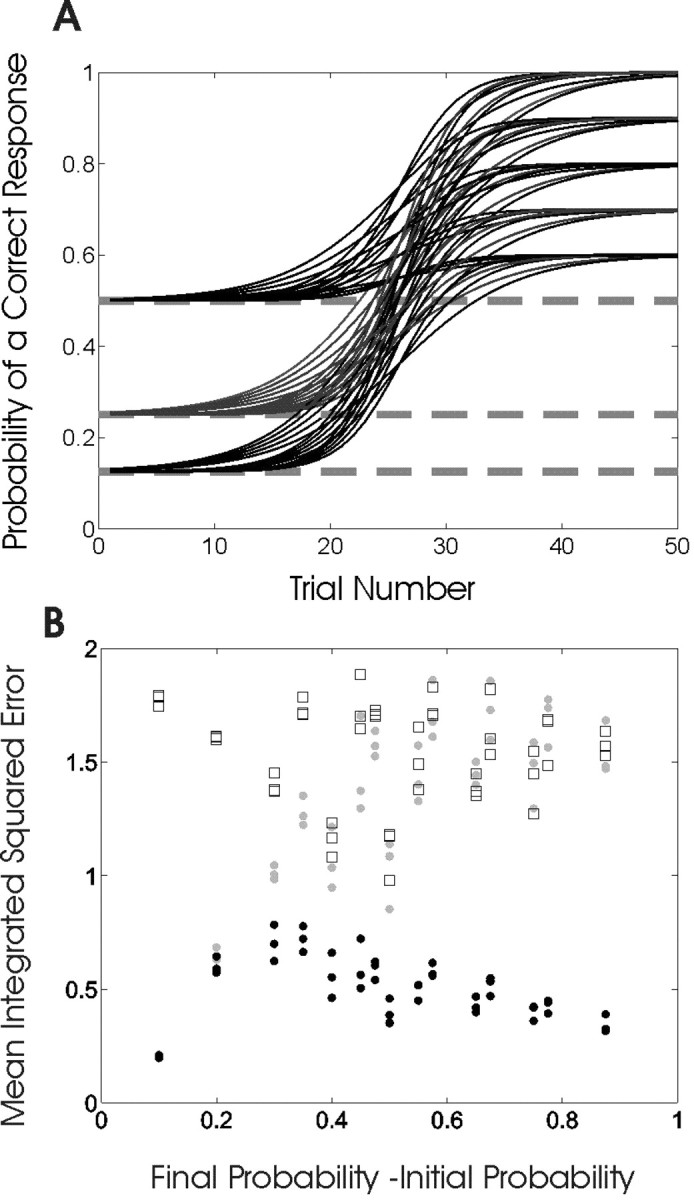
A, Family of sigmoidal curves (Eq. 3.1) used to simulate the learning experiments. Learning curves were constructed using three values of the initial probability of a correct response p0 (0.125, 0.25, and 0.5), five values of the final probability of correct response pf (0.6, 0.7, 0.8, 0.9, and 1), and three values of γ (0.2, 0.3, and 0.4), which governs the rate of rise or learning rate of the curves. For each of the 3 × 5 × 3 = 45 learning curves, we simulated 100 learning experiments for a total of 4500. All of the curves increase monotonically from p0, indicating that performance is better than chance on all trials, i.e., learning starts immediately. B, MISE for the filter algorithm (gray dots), the smoothing algorithm (black dots), and the moving average method (squares) for each of the 45 learning curves in A plotted as a function of pf - p0. The smoothing algorithm MISE is smaller than those of the filter algorithm and the moving average method for all values of pf - p0 above 0.1.