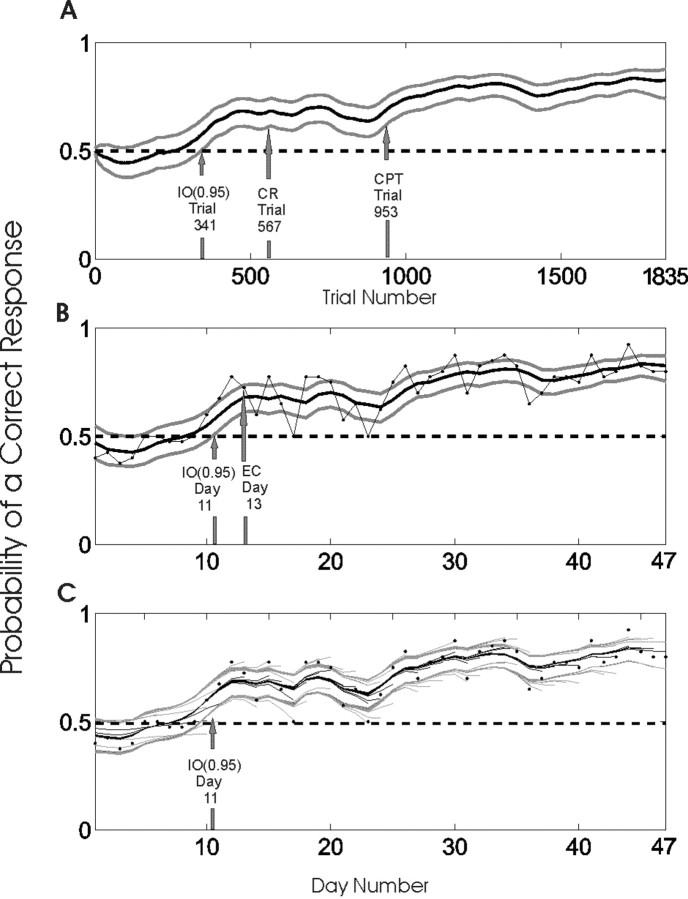
Figure 7.
Performance of a rat during a 47 d T-maze procedural learning task. The rat performed 40 trials per day, except on day 1 (20 trials) and day 46 (15 trials), for a total of 1835 trials. The data were analyzed using the smoothing algorithm and the IO (0.95) criterion in a trial-by-trial analysis (A) and in a day-by-day analysis using the smoothing algorithm with the binomial observation model (Eq. 3.2) and the IO (0.95) criterion and the number of correct responses on each day as the observed data (B, C). The learning curve estimates for each analysis (solid black lines) and the associated 90% confidence intervals (gray lines) are shown. In B, the black dots connected by the gray lines are the proportions of correct responses on each day. The probability that correct response occurred by chance was 0.5 in this experiment (dashed horizontal lines in all panels). The learning trial estimates for the trial-by-trial analysis in A were as follows: IO (0.95), trial 341 on day 9; the change-point test (CPT), trial 953 on day 24; and the fixed criterion of 15 consecutive correct responses (CR), trial 567 on day 14. The estimates of the learning day for the day-by-day analysis in B were as follows: IO (0.95), day 11; and the empirical criterion (EC) of Jog et al. (1999), day 13. C, The data were also analyzed on a day-by-day basis as the experiment progressed by computing the learning curve from the start to the end of the data series as the end was moved from day 3 to day 47. The 45 learning curves (black lines) and their associated 90% confidence bounds (gray lines) are plotted in C with the proportion of correct responses on each day (black dots). The “whispy” appearance of the plot is attributable to the fact that each learning curve and its associated confidence intervals were estimated with a different number of days of data, and, hence, each has different end points. In each analysis from day 12 to 47, the IO (0.95) criterion identified the learning day as day 11. The fact that the upper 95% confidence bound fell below 0.5 at trial 4 (B, C) suggests that the animal might have had a response bias at the start of the experiment.

