Figure 2.
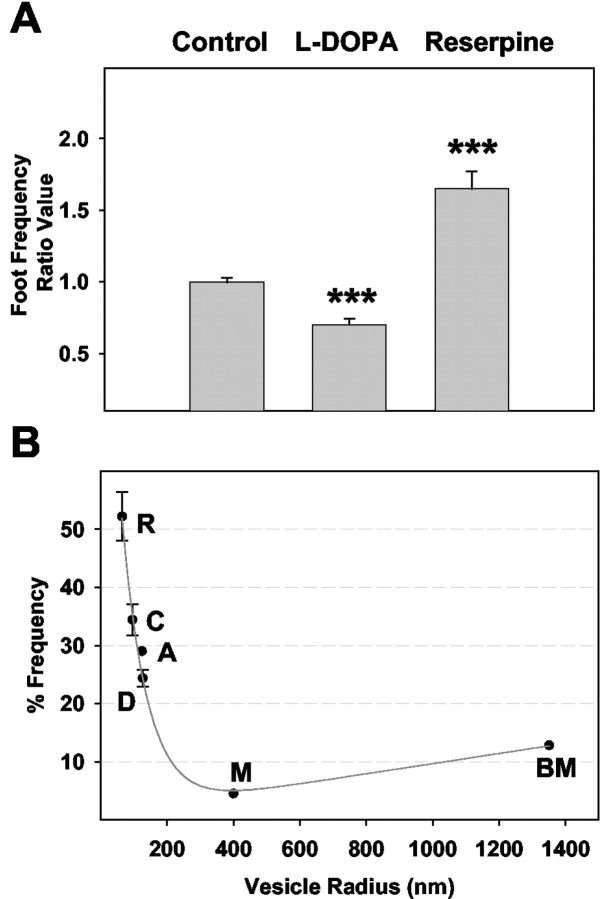
A, Summary of mean foot frequency ratio values created at individual PC12 cells (see Materials and Methods). For the ratios presented, an average of 117 ± 14 and 87 ± 21 amperometric values were used to determine before and after means, respectively. Error bars represent the mean ± SEM of foot frequency ratio values for the different experimental conditions (control, n = 6 cells; l-DOPA, n = 6; reserpine, n = 5). Because the mean foot frequency ratio values approximate 1 for control cells, it is clear that the incubation time itself did not have a significant effect on foot frequencies. B, Plot of foot frequencies calculated in this work as compared with foot frequencies reported in the literature for various-sized vesicles. Foot frequencies for PC12 cells were calculated by taking samples of mean values for different cells [reserpine-treated cells are denoted “R” in plot (n = 5; foot frequency of 52 ± 4%), saline-treated (control) cells are denoted “C” (n = 6; foot frequency of 34 ± 3%), and l-DOPA-treated cells are denoted “D” (n = 6; foot frequency of 24 ± 1%)]. Literature values are plotted for bovine adrenal chromaffin cells (denoted “A” in plot) (Chow et al., 1992), mouse mast cells (denoted “M” in plot) (Alvarez de Toledo et al., 1993), and beige mouse mast cells (denoted “BM” in plot) (Alvarez de Toledo et al., 1993), which have average vesicular radii of 125 nm (Neher, 1993), 400 nm (Breckenridge and Almers, 1987), and 1350 nm (Breckenridge and Almers, 1987), respectively. **p < 0.01 and ***p < 0.001 versus control, respectively (t test).

