
Figure 3.
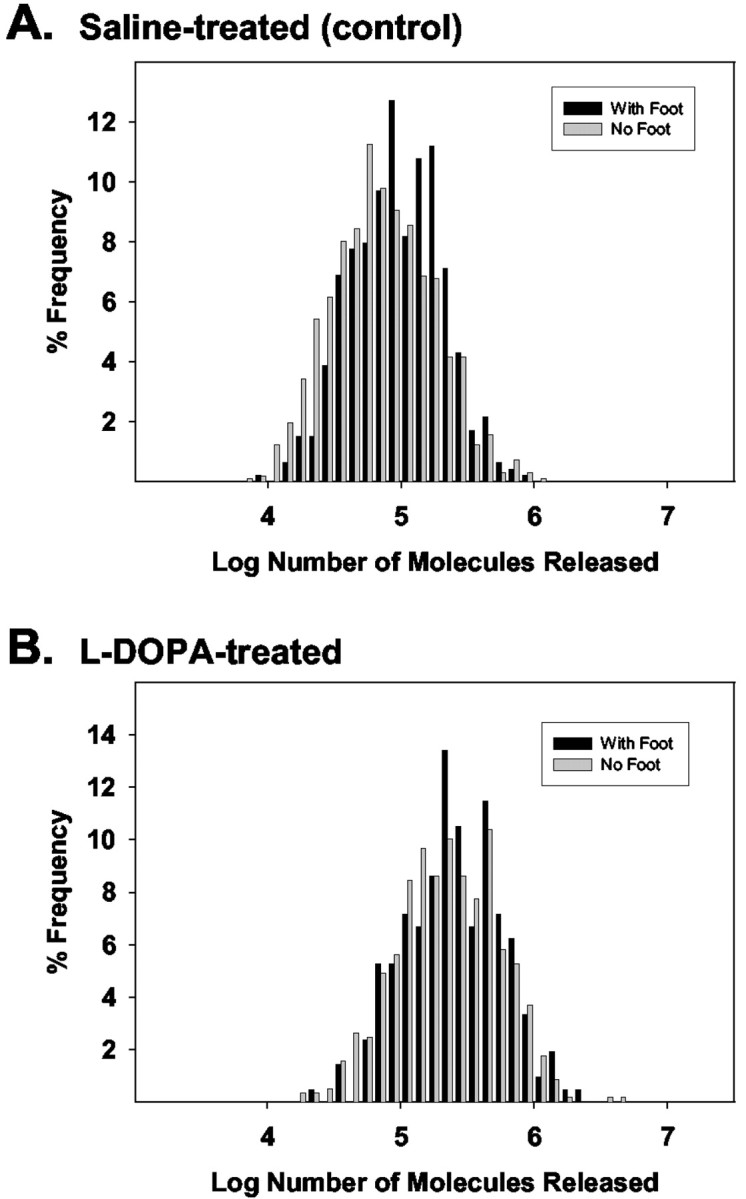
Histograms of raw spike characteristics are heavily skewed to the right, so normalized histograms from log-transformed values were created (Pothos et al., 1998b; Colliver et al., 2000b). A, B, A comparison of the Gaussian distributions for the log transform of the number of molecules released for those spikes with feet, and without, in the control condition (n = 6 cells) (A) and after a 90 min incubation in 100 μm l-DOPA (n = 6 cells) (B). Although a shoulder appears to be present in the distribution of control cells with versus without feet, there is not a significant shift in the Gaussian distributions under either set of conditions presented here in either control or l-DOPA-treated cells.