
Figure 4.
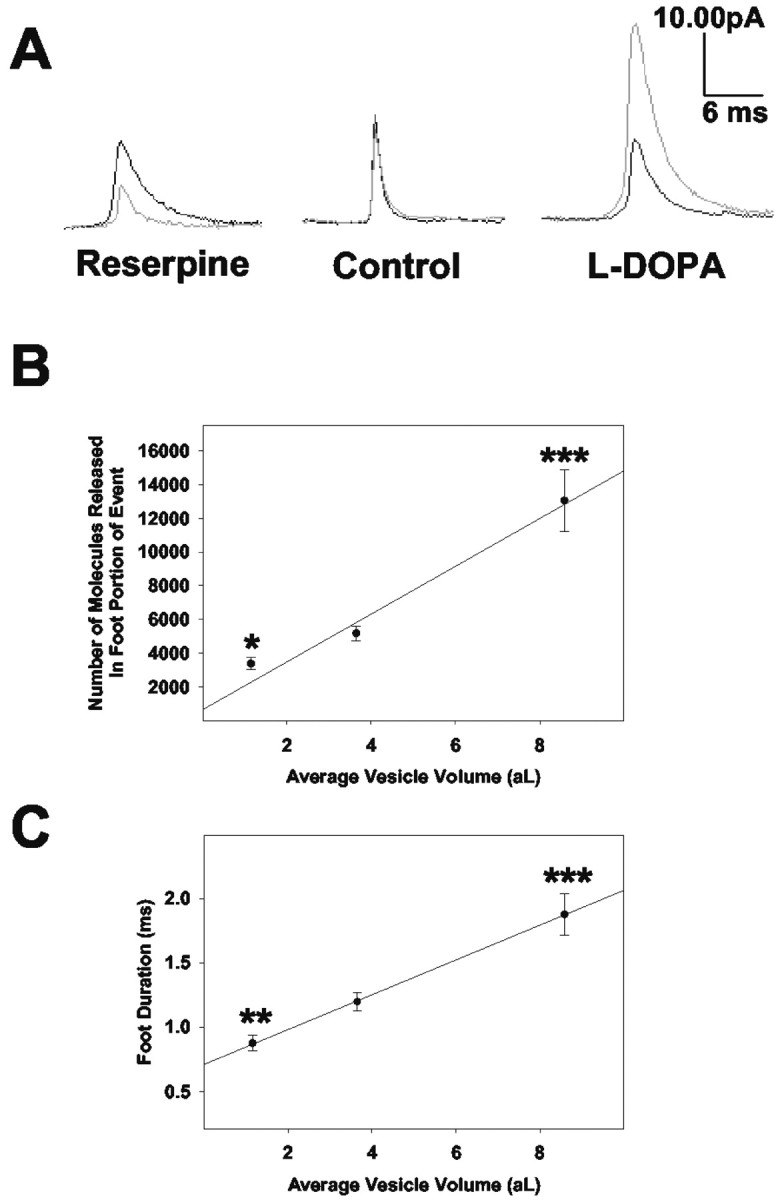
Both the number of molecules released through the exocytotic fusion pore and the time course of said release are dependent on vesicular size. Calculations for vesicular volume are as described in the Materials and Methods. A, Averaged amperometric current transients for one reserpine-treated (n = 28 before; n = 37 after), saline-treated (n = 85 before; n = 73 after), or l-DOPA-treated (n = 73 before; n = 41 after) PC12 cell before (black) and after (gray) the 90 min incubation period. The scale bar is the same for all three averaged transients. The traces appear without the typical shelf-like feature of a foot. This is primarily a consequence of the averaging of the amperometric traces, which exhibit variable foot geometries. B, Mean foot area values shown as a function of vesicle volume. Under control conditions, a cellular average of 5695 ± 751 molecules were released through the fusion pore (before full fusion) per event. C, Mean foot duration values (the time lapse between the onset of the foot and the inflection point between the foot and the full fusion event) shown as a function of vesicle volume. Under control conditions, the average cellular time course for release through the fusion pore was 1.3 ± 0.1 msec. For the data plotted, all amperometric foot signals were pooled to determine the mean foot area and duration values for reserpine, control, and l-DOPA-treated conditions, respectively. Error bars represent the mean ± SEM of the foot characteristic values for the different experimental conditions (control, n = 6; l-DOPA, n = 6; reserpine, n = 5). *p < 0.05, **p < 0.01, and ***p < 0.001 versus control, respectively (t test).