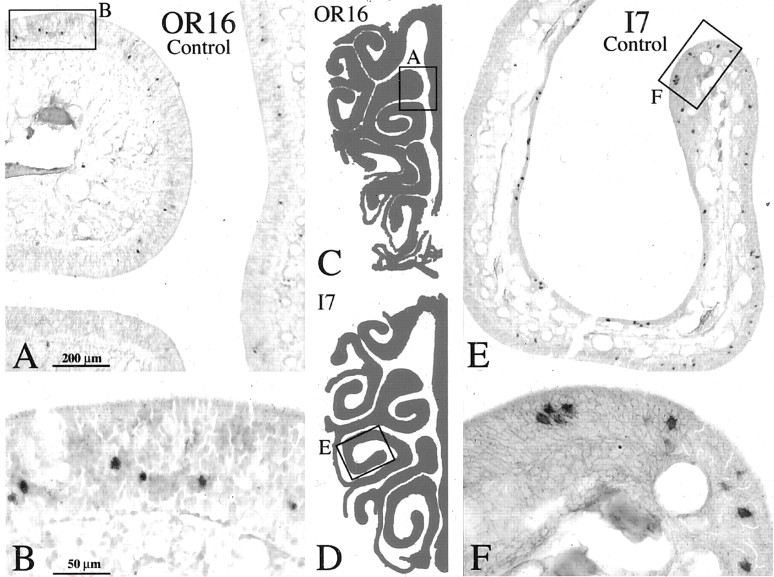
Figure 1.
Neuronal labeling by ISH with either the OR16 (A) or I7 (E) OR probe in normal rat OE visualized with alkaline phosphatase. Boxed areas are shown at higher power in B and F, respectively. Labeled cells are scattered across a restricted territory of the OE and may be close to each other or more highly separated. C, D, Schematics of the OE illustrating the locations of A and E. Scale bars: (in A) A, E, 200 μm; (in B) B, F, 50 μm.

