
Figure 11.
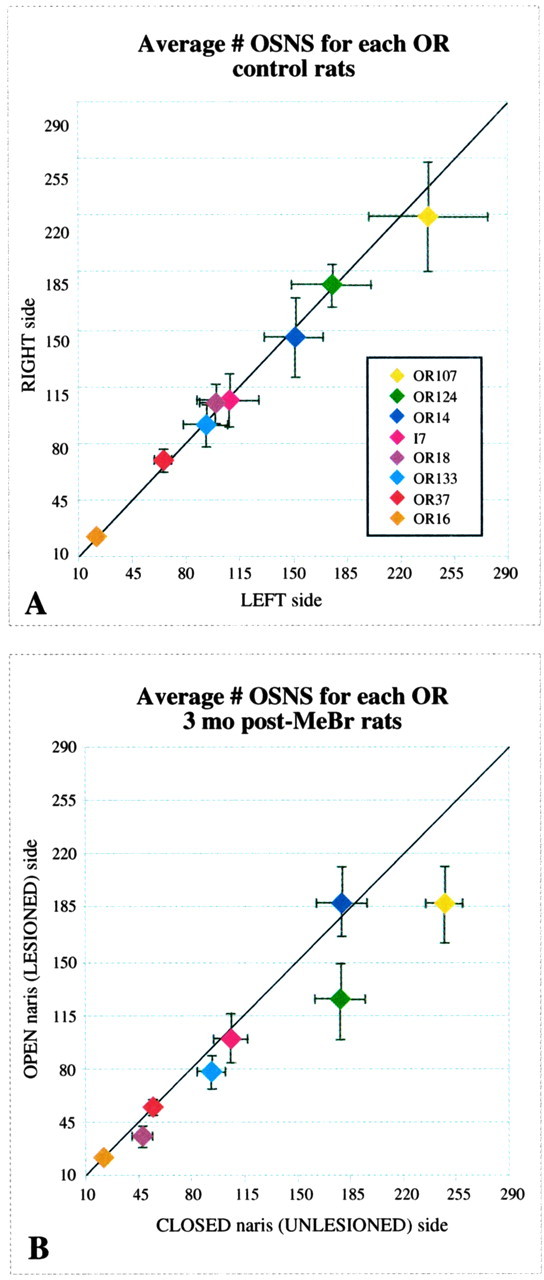
A, The average number of probe-positive OSNs in normal rat OE is illustrated for each OR (n = 5). There is no systematic difference in number between the two sides across this set of probes; however, note the variation in total cell number for each OR. B, The average number of probe-positive OSNs in the OE of unilaterally exposed rats is illustrated for each OR (n = 7). Neurons labeled by OR107 and OR124 are fewer in number on the lesioned-recovered side, whereas the rest of the probe-positive populations fall near the line indicating equal numbers on the unlesioned and lesioned-recovered sides.