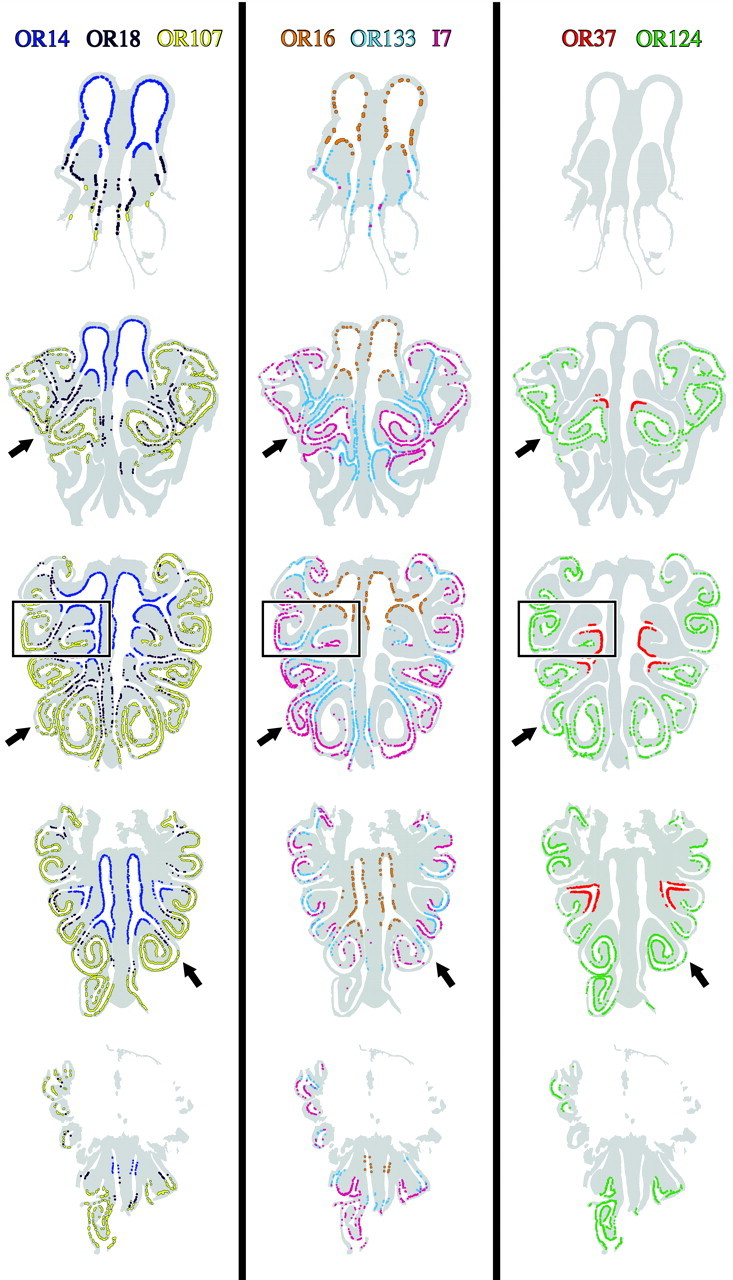
Figure 2.

Schematics illustrating OR expression patterns throughout the extent of normal rat OE. Each colored dot designates an OR-positive OSN in a single subject (CI-142) using each of eight OR riboprobes. At each level, the labeling on the eight adjacent sections was compiled onto a single schematic although the OR distributions were separated into three panels for ease of visualization. The boxed area is shown at higher power in Figure 3. The arrows indicate areas where multiple ORs overlap, but only partially.
